U.S. Ethanol Exports Rebound in 2014
Contact:
Printer-friendly PDF (159.26 KB)
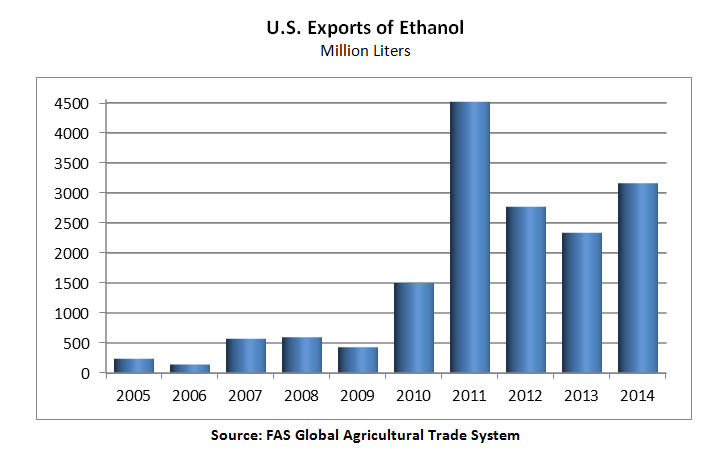
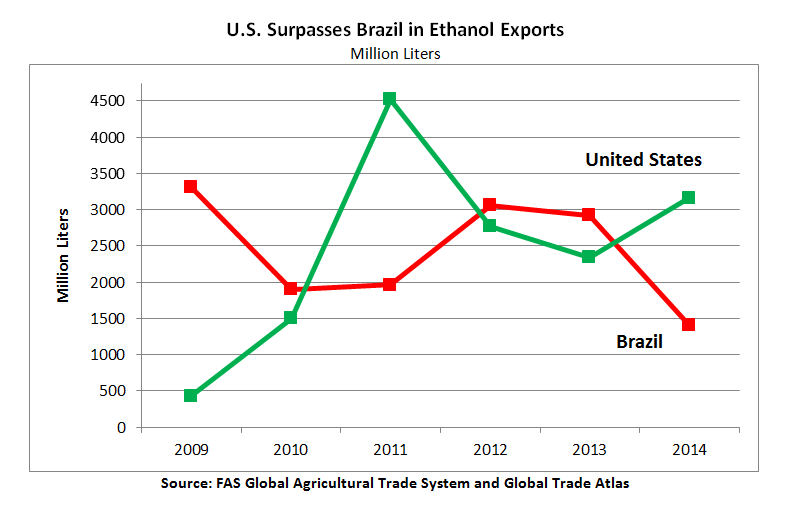
U.S. ethanol exports rebounded in 2014, with value and volume both up approximately 35 percent from the previous year, although still below the record set in 2011. At nearly 3.2 billion liters (836 million gallons), U.S. ethanol exports were worth more than $2 billion dollars. Six percent of ethanol produced in the United States was exported last year, and the United States overtook Brazil as the world’s largest exporter. U.S. ethanol exports are also being shipped to a more diverse range of markets.
U.S. Production Reaches Record Level, Imports Drop
The United States is, by far, the world’s largest producer of ethanol, with an output more than double that of the next-largest producer, Brazil. The United States implemented the Renewable Fuel Standard (RFS) in 2005 and expanded it in 2007, mandating that transportation fuel sold in the United States contain an increasing volume of ethanol or other biofuels. Since 2007, ethanol production in the United States has soared, more than doubling in just three years from 23 billion liters (6.5 billion gallons) in 2007 to 49 billion liters (13.3 billion gallons) in 2010.
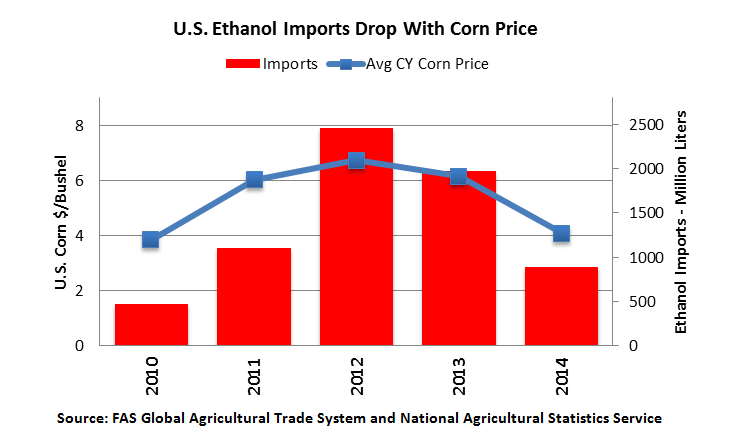
After 2010, U.S. ethanol production stagnated due to the approaching 10-percent “blend wall” (an upper limit on the amount of ethanol that can be blended in motor fuel for conventional vehicles, constraining the widespread use of 15-percent, or E-15, and 85-percent, or E-85, blends), and rising price of corn, which is by far the largest feedstock for U.S. ethanol. However, in 2014 ethanol production jumped nearly eight percent, reaching a record 54 billion liters (14.3 billion gallons). Among the driving forces behind the upturn were lower corn prices and a recovery in gasoline consumption following the 2008-2012 decline due to the recession and rising oil prices. Record U.S. corn crops in 2013 and 2014 caused a sharp drop in prices, with the farm-gate value in mid-2014 registering about 40 percent lower than the same time the previous year. U.S. ethanol imports (including both fuel and non-fuel ethanol) dropped by more than half in 2014, to less than 900 million liters, the lowest level since.
United States Becomes Largest Exporter in 2014, Surpassing Brazil for the Second Time
With growth in domestic ethanol consumption constrained by the blend wall and projected reductions in U.S. gasoline consumption in the next decade, refiners and traders are increasingly looking to export markets. In 2014, U.S. ethanol exports reached the second-highest level in history, and approximately six percent of domestically produced ethanol was exported. Net exports were valued at $1.3 billion, the highest in the world. Most of the ethanol exported from the United States is sold and shipped by traders, but some ethanol companies also export directly to foreign buyers.
The United States and Brazil dominate the global market, accounting for three-quarters of world ethanol trade. While Brazil has traditionally been the largest exporter of ethanol, in 2014 Brazil’s exports fell sharply, from 2.9 billion liters to only 1.4 billion. The United States took over the top spot, shipping more than twice as much as Brazil, and accounting for about half of the six-billion-liter global ethanol market. Brazilian ethanol is produced from sugarcane and production depends on the economics of sugar prices. The primary reason for the fall in Brazilian exports was a lower sugar cane harvest in Brazil, coupled with reduced import demand from the United States, which typically accounts for 60 percent of Brazil’s exports. Another factor, which is likely to impact Brazil’s exports in the future, is growth in domestic consumption of ethanol. The Brazilian government recently raised the blend mandate in Brazil from 25 to 27 percent, which should boost domestic use.
U.S. Ethanol Export Markets Diversify
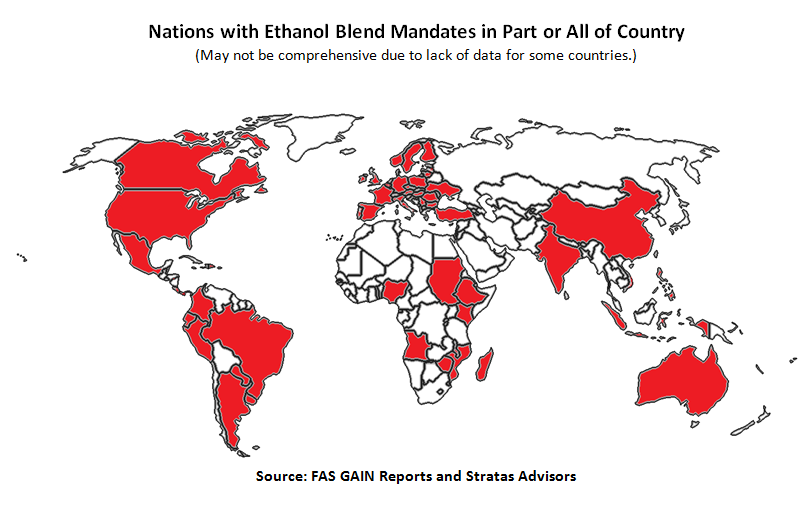
U.S. ethanol exports have typically been concentrated in three key foreign markets – Canada, Brazil, and the European Union. As recently as 2011, more than 80 percent of U.S. ethanol exports went to these markets. However, in recent years U.S. ethanol exports have become more diversified, and the United States now exports to more countries around the globe. An important driver of global ethanol demand is the existence of government mandates specifying that a certain percentage or volume of ethanol be blended with gasoline. In many countries, blend mandates function as targets rather than requirements. It is estimated that 84 percent of U.S. ethanol exports in 2014 went to countries with mandates in place.
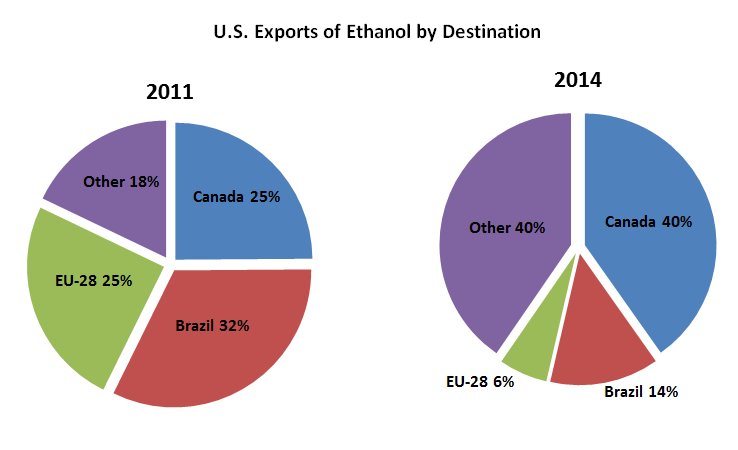
Canada: Canada has been the largest and most dependable market for U.S. ethanol exports, accounting for more than 40 percent of total exports. U.S. exports to Canada have increased every year for the past five years. Canada surpassed the United States as the largest ethanol importer in 2014. Canada has a national blend mandate of five percent, but statistics suggest that the actual blend rate has exceeded that due to discretionary blending as well as the fact that some provinces have higher mandates than the national level.
Brazil: Exports to Brazil, the world’s second-largest ethanol producer, doubled this past year, making Brazil the number two market for the United States. However, U.S. ethanol exports to Brazil were far below the levels of 2011 and 2012 when high sugar prices discouraged domestic Brazilian ethanol production and encouraged imports.
EU-28: The European Union had been a major importer of U.S. ethanol, accounting for about a quarter of all U.S. exports between 2010 and 2012. However, anti-dumping duties were put in place in 2013, and since then U.S. exports have dropped sharply. In 2014, shipments to the EU made up only six percent of U.S. exports. The EU now relies on imports from other countries including Guatemala, Pakistan and Peru.
Other Markets: The strongest growth in U.S. exports in 2014 was to the United Arab Emirates, the Philippines, and India – the third-, fourth-, and sixth-largest markets, respectively. The United Arab Emirates is largely a discretionary blending market, with imports driven by the relative price of ethanol and gasoline rather than an established blend mandate. The Philippines has a 10 percent blend mandate, but domestic ethanol production (using sugar cane and molasses as feedstocks) has been unable to meet this requirement, necessitating imports. India has a five percent blend mandate but the target has not been met due to insufficient fuel ethanol supplies.
U.S. Ethanol Exports, Volume
| Market | 2010-2011 Average (million liters) | 2014 (million liters) | Change | U.S. Market Share |
| Canada | 789 | 1,272 | +61% | 98% |
| Brazil | 773 | 425 | -45% | 89% |
| EU-28 | 780 | 190 | -76% | 4% |
| United Arab Emirates | 177 | 259 | +46% | 75% |
| Philippines | 36 | 256 | +602% | 55% |
| India | 74 | 157 | +133% | 61% |
| South Korea | 21 | 136 | +542% | 23% |
| Mexico | 93 | 115 | +24% | 80% |
| Other | 262 | 354 | +34% | -- |
| Total | 3,007 | 3,163 | +5% | Approx. 50% |
