Processed Product Spotlight: Confectionery
Contact:
Printer-friendly PDF (336.12 KB)
Young, urban consumers in emerging markets with rising disposable incomes helped propel global imports of confectionery products to $21 billion in calendar year 2013. U.S. confectionery exports reached a record $2.2 billion, an increase of 10 percent over the previous year.
Global Market for Confectionery Continues to Expand
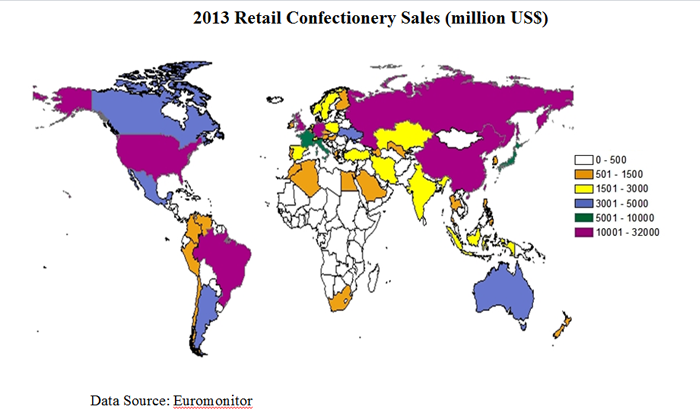
The global market for confectionery products reached a record $196 billion in 2013, up $10 billion from the previous year. Much of the growing demand is taking place in developing markets where population growth, rising incomes and urbanization are helping to drive consumption. Over the past five years, retail confectionery sales in the Middle East, Africa, Latin America, Eastern Europe and Asia Pacific regions grew at a combined, compound annual growth rate of seven percent., Sales to the region now account for approximately half of global confectionery sales. By contrast, retail sales in North America and Western Europe grew by just two percent during the same time period.
While chocolate is the most popular confection category, the composition of confectionery sales differs widely from market to market. For instance, sugar confectionery accounts for 60 percent of the value of confectionery retail sales in China but just 25 percent in the European Union.

Import Demand Driven by Developing Countries
Most confectionery products are produced and consumed locally but demand for imports is growing. Global imports reached $21 billion in 2013, an increase of more than 50 percent compared to five years ago. On a volume basis, imports grew by 40 percent during the same period.
China is one of the fastest-growing emerging markets for confectionery imports. Chinese imports have grown at a compound annual growth rate of 27 percent over the last five years, reaching $711 million in 2013. Chinese confectionery retail sales are projected to increase by 50 percent over the next five years, to $21 billion by 2018. An expanding Chinese middle class and an increasingly urban population are driving much of this growth. In addition to the major markets of Shanghai and Beijing, there is significant demand growth in second-tier cities, such as Chengdu and Wuhan. China is now the world’s fourth-largest confectionery retail market behind the United States, Europe, and Russia. According to Euromonitor, Chinese consumers spent an estimated $10 per capita on confectionery products in 2013, compared with $100 for U.S. consumers.
U.S. Confectionery Exports Reach Record High
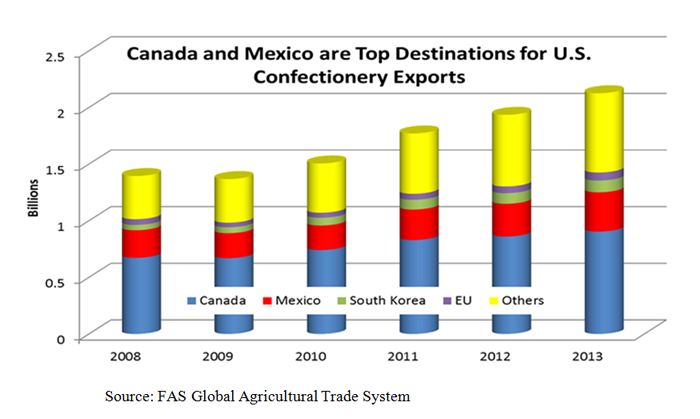
U.S. confectionery exports have been on the rise, growing 56 percent in just five years to reach a record $2.2 billion in 2013. The United States is now the world’s second-largest confectionery exporter behind the European Union. Developing countries now account for approximately half of U.S. confectionery exports, up from 44 percent five years ago.
The top three U.S. confectionery markets are Canada, Mexico and South Korea. Canada accounted for 42 percent of all U.S. confectionery exports in 2013, followed by Mexico at 16 percent and South Korea at five percent. U.S. export growth to Canada, a relatively mature market, has been impressive, increasing by nearly 50 percent over the last five years to $905 million in 2013. According to Euromonitor forecasts, the Canadian market is expected to exhibit modest growth over the next several years with annual increases of four percent in value and 0.8 percent in volume through 2018. The United States holds a 56-percent share of the Canadian confectionery import market. The EU is Canada’s second-largest supplier after the United States with a 22 percent market share.
Mexico, the second-largest U.S. confectionery export destination, continues to be fertile ground . U.S. exports reached a record $348 million in 2013, up 20 percent from the previous year. The U.S. share of the Mexican market is nearly 70 percent. Other key suppliers to the Mexican market are Canada and the EU, each with a 10-percent market share.
With a 25-percent market share, the United States is the second-largest supplier of confectionery products to South Korea. U.S. exports in 2013 reached a record $104 million, an increase of 12 percent from the previous year. The EU remains the dominant player in the South Korean market with a 35 percent market share. The EU and the United States both have free trade agreements with South Korea and benefit from reduced tariffs on confectionery products.

Trade Liberalization Helps Drive Exports
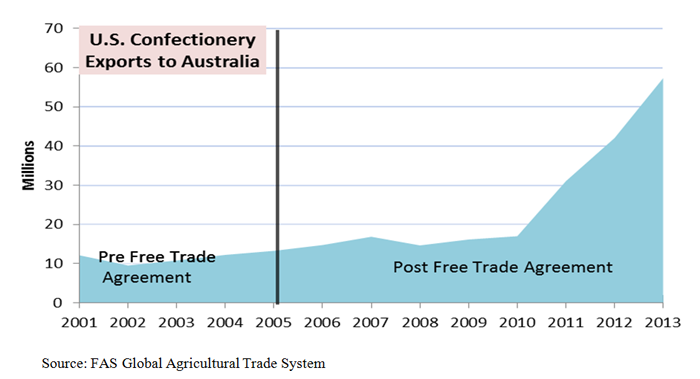
U.S. exporters of confectionery products have benefited from trade liberalization achieved through free trade agreements. Countries with which the United States has free trade agreements – including Peru, Australia, Panama, Colombia and Singapore – rank among the 10 fastest-growing markets for U.S. confectionery exports. Australia is a case in point. U.S. exports to Australia have expanded at an annual rate of 20 percent since the free trade agreement entered into force in 2005. Australia is now the sixth-largest destination for U.S. confectionery products.

Note: Confectionery products, as defined in FAS’s Global Agricultural Trade System data base, include the following HS codes: 170410, 170490, 180310, 180320, 180400, 180500, 180610, 180620, 180631, 180632, 180690.
