Money Does Grow on Trees as U.S. Forest Product Exports Set Record
Contact:
Link to report:
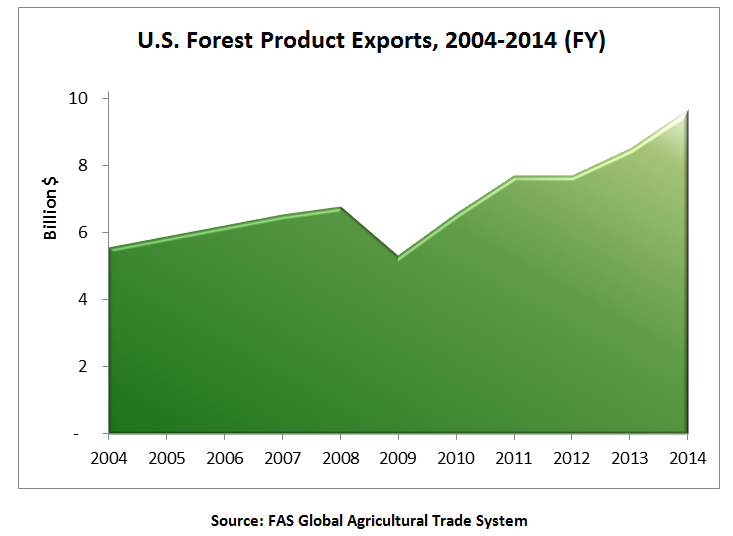
The United States exported a record $9.7 billion of forest products in fiscal year 2014. Among U.S. agricultural exports, only corn and soybeans had higher export values. As the world’s fourth-largest exporter of forest products (behind the European Union, China, and Canada), the United States maintains a steady share of the growing global market at just over 10 percent.
U.S. forest product exports have grown 80 percent over the last five years. The majority of this growth was due to growth in volume, as prices have remained relatively flat. Despite the growth in export volume, U.S. timber stocks (uncut trees in the forest) have experienced net growth for the last 50 years as new growth is now much higher than the harvest rate.
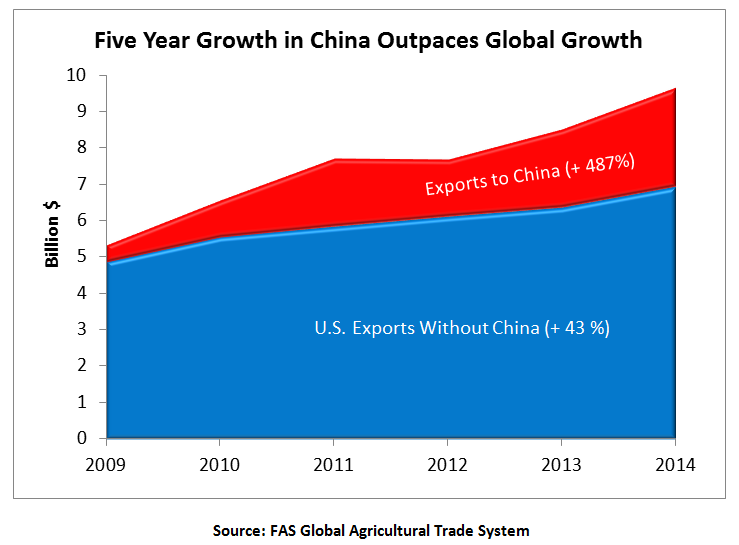
The overall steady growth of U.S. forest product exports has been fueled by rapid growth in hardwood lumber and softwood log exports to China.
Logs and Lumber Are Top Forest Product Exports
In FY 2014, total exports were up 14 percent from the previous year, with exports in almost all product groups reaching record levels. While logs and lumber represented the highest value, fuel exports – primarily in the form of wood pellets – experienced the fastest growth, mainly due to new demand for renewable fuels from the EU. Compared to other agricultural commodities, forest products are more sensitive to short-term economic movement and most products saw dramatic changes in their growth trajectory following the global financial crisis in 2009.
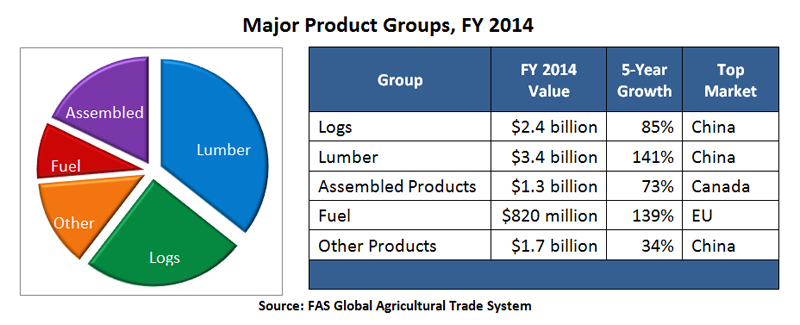
Lumber: Due to significant demand for U.S. hardwood lumber, the overall value of lumber exports jumped almost 25 percent from FY 2013 to FY 2014. Hardwood lumber exports accounted for more than 70 percent of all U.S. lumber exports and realized 160-percent growth in the last five years. During the global financial crisis, hardwood lumber exports took a steep dive, losing almost half their value. However, since 2009, overseas demand for hardwood lumber has recovered and exports have rebounded. The majority of recent growth has been new volume, increasing 118 percent over the last five years to 2.8 million metric tons (MT) in FY 2014.
Logs: Log exports were stagnant at the beginning of the last decade. But in FY 2009, softwood log exports began to climb, increasing by value at an average of 20 percent per year. By FY 2014, softwood logs accounted for nearly three-quarters of all log exports, at a value of $1.7 billion. Because of this sudden demand for softwood logs, prices have increased accordingly, with the growth in value almost double the growth in volume. Conversely, hardwood log exports have remained steady around $600 million for the last decade and actually decreased slightly in terms of volume.
Assembled Products: Exports of assembled products climbed steadily higher, hitting a record $1.3 billion in FY 2014. Top exports included pre-fabricated wood buildings, fabricated structural members, assembled casks, door frames, and joinery products. While some assembled products may use hardwood, the majority of wood used is softwood.
Fuel (Wood Pellets and Wood Chips): In FY 2014, fuel exports reached record levels at over $800 million, an increase of almost 40 percent compared to FY 2013. While lumber and logs represent the largest value for forest product exports, fuel is clearly the fastest-growing product group, mostly due to increased wood pellet exports.
The growth in wood pellet exports is directly attributable to the European Commission’s 2009 Renewable Energy Directive, which mandated that, by 2020, the EU fulfill at least 20 percent of its energy needs using renewable sources. (See U.S. Energy Information Administration report.) Wood pellets are generally produced from wood waste (including sawdust, chips, and shavings) and are an important renewable fuel source that can be used for generating electricity.
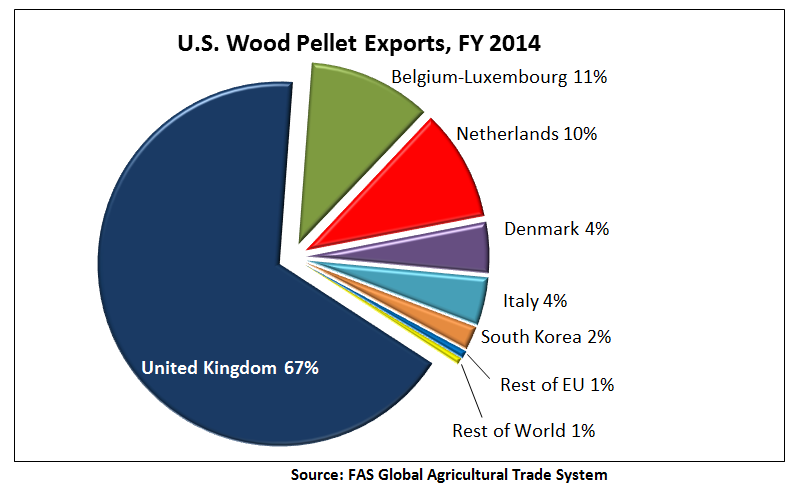
In FY 2014, the United States exported 3.8 million MT of wood pellets, 97 percent of which went to the EU. Within the EU, the United Kingdom, Belgium, and the Netherlands were the largest importers (see chart below). In FY 2014, the United States claimed a 60-percent share of the EU wood pellet market, up from 44 percent in 2013. EU demand for wood pellets is expected to continue growing, assuming individual EU member states adopt reasonable sustainability standards that will not unnecessarily impede exports from the United States or elsewhere.
Other Products: Engineered wood products include plywood, oriented strand board, fiberboard, and particle board. While the export value of engineered products continues to rise, export growth has been slow (less than 30 percent over the last decade). However, concerns over the safety of certain engineered wood products produced overseas may increase demand for U.S. products, which generally undergo more transparent and rigorous safety testing.
Milled products include veneers, flooring, moulding, and dowels. At roughly $600 million in FY 2014, export value has actually decreased over the past decade due to other countries’ increasing capacity to mill raw logs and lumber domestically.
Other notable forest product exports include wood pulp, railroad ties, wood flour, and densified wood. Overall, these products have experienced slow export growth.
China Becomes Top Destination
United States forest exports set records in FY 2015 in three of the top five markets – China, Canada, and Mexico. The China market experienced the greatest increase, moving into the top position. Collectively, the top five markets (see chart below) make up more than 80 percent of all U.S. forest product exports, by value. In the last five years, Canada and Mexico both sustained steady annual growth, realizing 35 percent and 50 percent gains in value, respectively. While exports to the EU and Japan have also increased during the last five years, these markets remain well below the peaks levels reached in 1995 and 1997, respectively. Overall, it is the incredible growth from the China market that has driven the rapid increase of U.S. forest product exports.
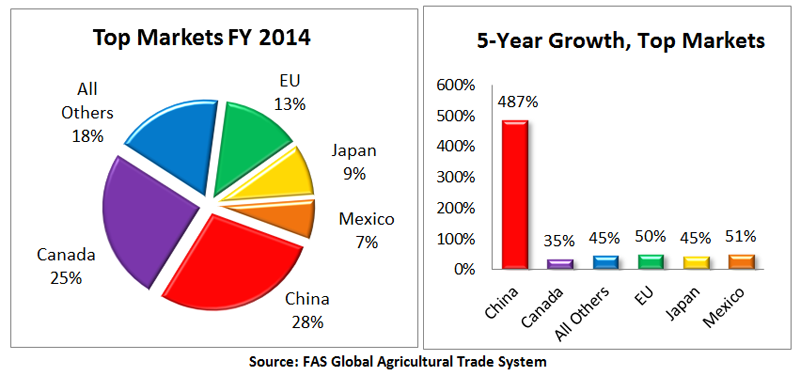
China’s growth was sudden and dramatic. Prior to 2009, China was a relatively minor market, accounting for less than five percent of U.S. forest product exports. However, since 2009, exports to China have grown almost 500 percent in value. By FY 2014, China became the top export destination for U.S. forest products with shipments of $2.7 billion, accounting for more than a quarter of all U.S. forest product exports.
U.S. market share in China had previously hovered around seven percent, but following China’s sudden demand for wood imports, the U.S. industry maneuvered to take advantage of this growth, nearly doubling its market share to 13 percent in FY 2014. In comparison, during this same time period, Russia (the top exporter to China) saw its market share decline from 37 percent to 14 percent. If current trends continue, the U.S. is poised to overtake Russia as the top supplier of wood products to China.
The United States’ top exports to China – hardwood lumber and softwood logs – accounted for nearly three-quarters of all U.S. forest product exports in FY 2014. While hardwood lumber has always been a top U.S. export to China, exports to China began to surge in 2009, realizing 100-percent annual growth. In FY 2014, the United States exported more than $1 billion in hardwood lumber to China. While the majority of this growth is due to increased volume, prices have also risen steadily (about 40 percent over the last five years).
While some hardwood lumber imported by China is being processed and re-exported, it appears that the majority is being consumed domestically. China’s current per-capita wood consumption is far below the world average and is expected to continue to grow as a result of strong economic growth and a rising middle class population. Imports of hardwood logs have also increased significantly (by about 30 percent annually) in the past two years, suggesting that Chinese mills are expanding their domestic capacity to mill hardwood logs into lumber and other value-added products.

The other major U.S. export to China has been softwood logs. Prior to 2009, the United States exported virtually no softwood logs to China but, since then, softwood logs have become the second-largest forest product export, valued at $950 million. While many of these softwood logs are milled domestically and re-exported as furniture (China is the world’s largest furniture exporter), it appears that most of this wood is being consumed domestically.
