Opportunities for U.S. Agricultural Exports in Spain and Portugal
Contact:
Link to report:

Executive Summary
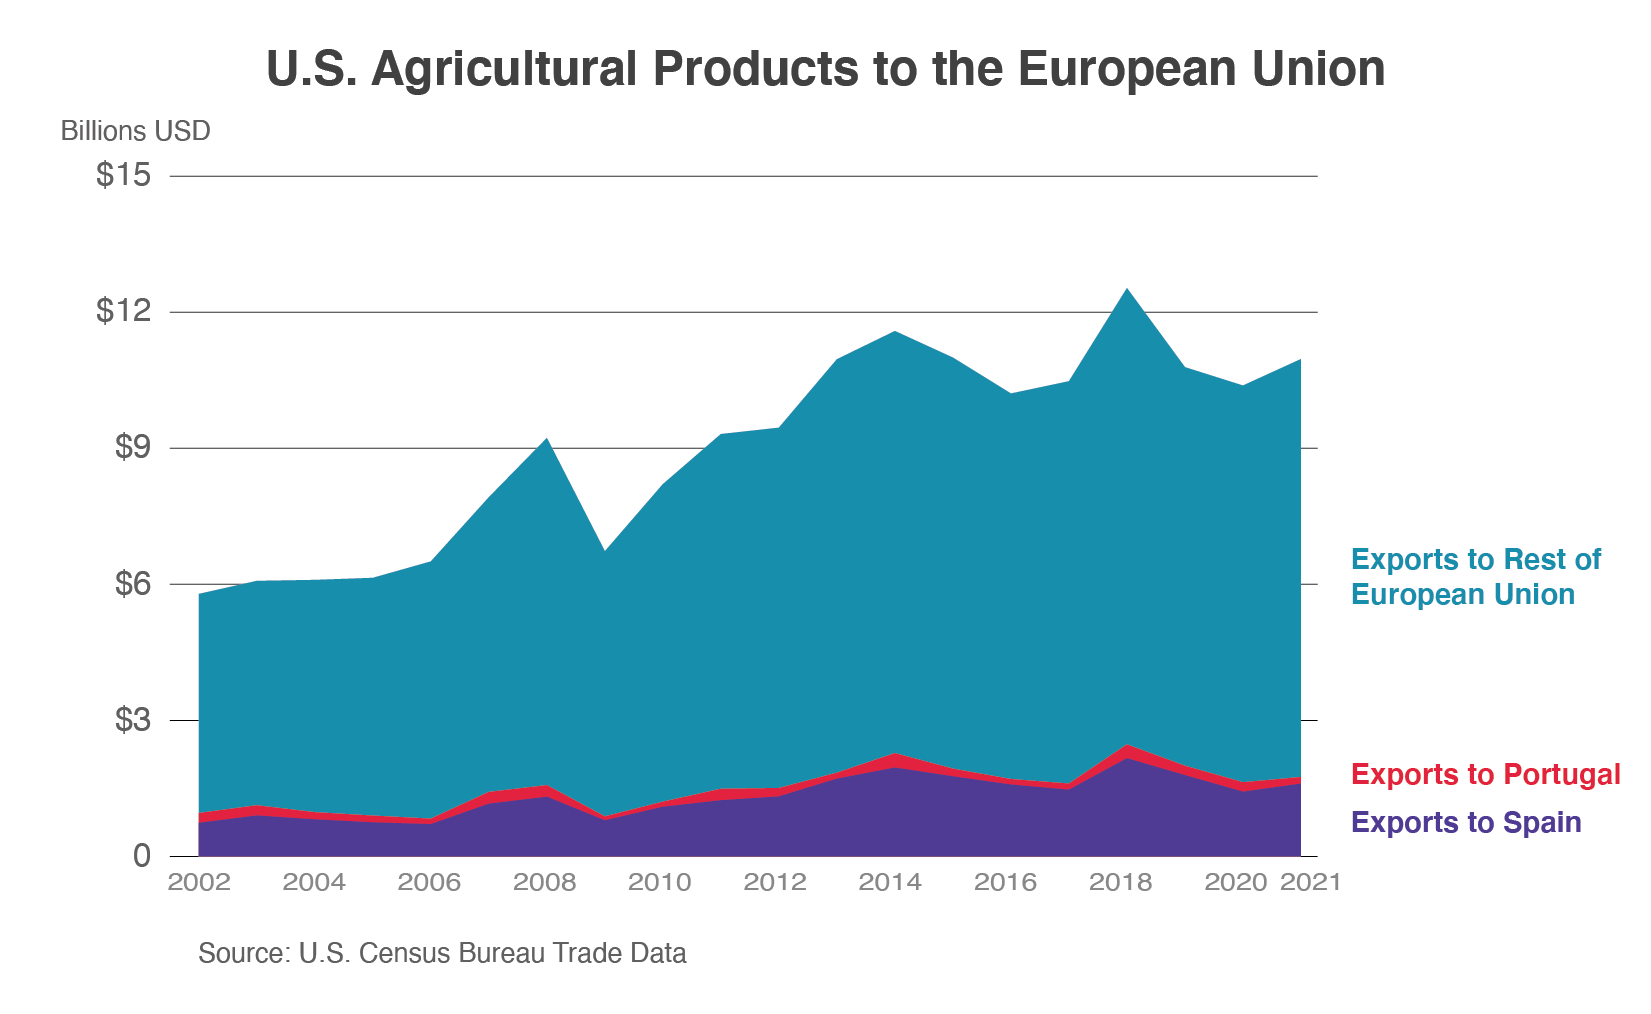
U.S. exporters can find ample opportunities in the Iberian Peninsula. Spain is the third-largest European Union (EU) destination for U.S. agricultural products, with Portugal ranking 11th. In 2021, the United States exported $1.6 billion of agricultural products to Spain, or 15 percent of total U.S. agricultural exports to the EU. The United States held a 4 percent market share of Spain’s agricultural imports and 2 percent market share in Portugal, behind other EU member states as a group and Brazil. The Iberian Peninsula has been a major gateway to Europe for U.S. agricultural products and contains many ports of entry including Lisbon off the Atlantic Ocean and Valencia on the Mediterranean Sea. Opportunities for U.S. agricultural exports to the region exist due to 1) good reputation among Spanish and Portuguese importers and retailers, 2) demand for innovative and sustainable products and packaging, 3) consumers’ familiarity with U.S. products, and 4) higher demand for healthy products.
Spain: Macroeconomic Perspective
Spain has a population of 47 million people, with a flat to negative population growth rate expected for the next decade. A large portion of Spain’s population are middle-aged adults, with a median age of 43.9 years. Except for Madrid, Sevilla, and Zaragoza, the largest urban areas are located along the Mediterranean and Atlantic coasts. According to the CIA World Factbook, Spain ranks as one of the lowest birth rate countries, resulting in Spain’s rapidly aging population. Exporters will have to adapt to the demographic change and consider future consumer trends and preferences in their long-term strategic marketing plans.
In 2021, Spain was the fifth-largest economy in the EU, with a 5.1 percent real gross domestic product (GDP) growth rate. According to S&P Global, the real GDP growth rate for Spain is expected to slow in 2022 and 2023 at 4.1 percent and 1.7 percent, respectively. Currently, Spain faces high inflation rates, persistent supply chain bottlenecks, and high input and energy costs. Households faced with increased costs are likely to curb spending on consumer durables and luxury goods. The 2023 growth projection is driven by faster monetary policy tightening by the European Central Bank and the prospect of higher Spanish inflation carrying over to 2023. There is some good news as several growth prospects in Spain remain: 1) tourism is expected to normalize as COVID-19-related travel restrictions are lifted, 2) consumers have access to higher-than-normal savings from lockdowns, and 3) private sector investment has been supported by funds available from the EU Next Generation Funds.
Consumer-Oriented and Bulk Product Exports to Spain Up 3 Percent and 33 Percent, Respectively
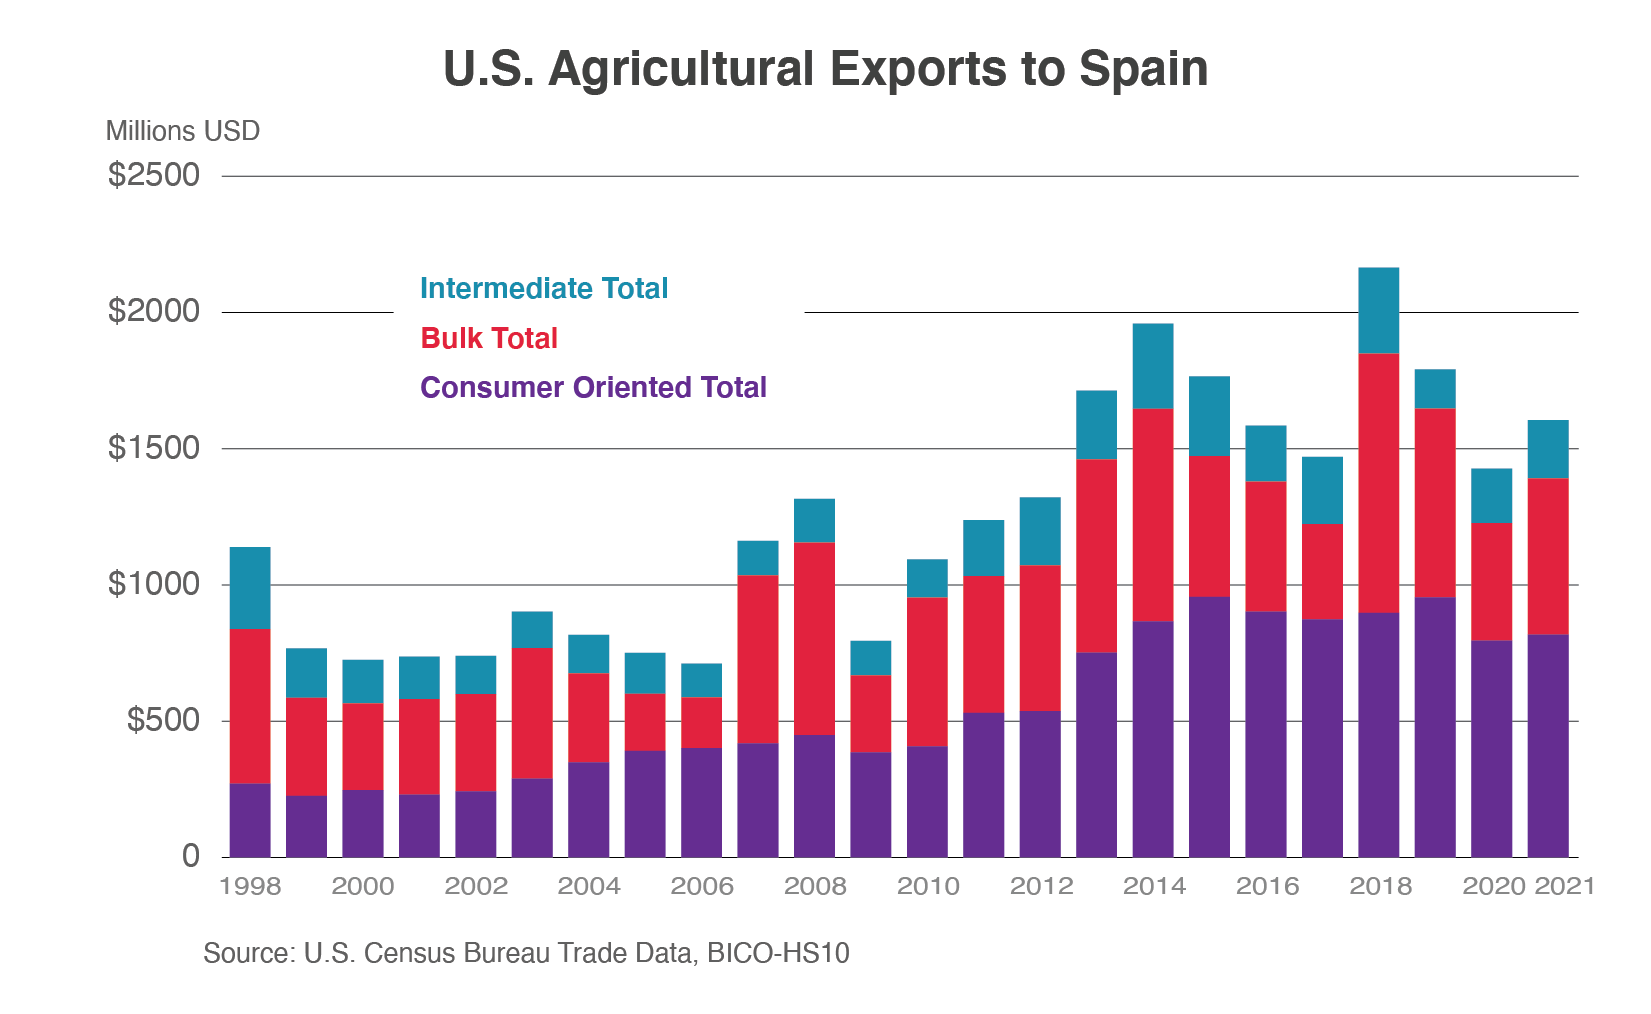
In general, U.S. products have a good image and reputation in Spain and fulfill buyers’ sustainability requirements. U.S. consumer-oriented product exports have maintained their strong momentum in Spain and are supported primarily by the food service and tourism sectors. In 2021, exports of consumer-oriented products increased by 3 percent, driven by distilled spirits, food preparations, and fresh vegetables. Bulk products were also up 33 percent, from higher soybean and sorghum shipments. During the last 20 years, U.S. bulk exports to the Iberian Peninsula were inconsistent, depending on commodity prices and global market dynamics (see fig. 1). Intermediate products in 2021 were up 7 percent due to increases in distillers’ grains and protein substances. Spain’s export-oriented livestock sector is also heavily reliant on imports of feed and feed ingredients. U.S. bulk commodities are well positioned to supply consumers’ demand for sustainable feedstock.
Figure 1: U.S. Agricultural Exports to Spain by Bulk-Intermediate-Consumer Oriented (BICO) Category, 1998-2021

Table 1: Top U.S. Agricultural Exports to Spain, Calendar Year
Value in Million Dollars
| Annual Exports | Market Share | |||||
| Top U.S. Ag Exports to Spain | 2019 | 2020 | 2021 | 2019 | 2020 | 2021 |
| 1. Tree Nuts | 799 | 664 | 666 | 62% | 62% | 55% |
| 2. Soybeans | 552 | 361 | 525 | 42% | 30% | 26% |
| 3. Distilled Spirits | 72 | 77 | 92 | 8% | 11% | 11% |
| 4. Soybean Meal | 25 | 83 | 74 | 6% | 9% | 4% |
| 5. Distillers Grains | 22 | 12 | 36 | 64% | 39% | 74% |
| 6. Pulses | 40 | 39 | 25 | 23% | 22% | 15% |
| 7. Dextrins, Peptones, & Proteins | 14 | 19 | 23 | 5% | 7% | 5% |
| Total Agricultural Exports | 1,792 | 1,427 | 1,605 | 5% | 5% | 4% |
Source: U.S. Census Bureau Trade Data, BICO-HS10; Trade Data Monitor, LLC, BICO-HS6 for market share
Spain’s Food Industry and Tourism Sectors Provide Long-Term Opportunities for U.S. Agricultural Exports
According to the USDA Exporter Guide (link), the food service and tourism industries have remained strong as tourist per capita expenditures on retail, food, and drinks increase. According to S&P Global, the tourism sector accounts for 10 percent of Spain’s GDP. As more COVID-19-related travel restrictions are lifted, the tourism industry moves closer to recovering fully as tourists are frequenting restaurants more often. From January to August 2021, Spain recovered 26 percent of tourists lost from the pandemic. In June 2022, more than 8.2 million tourists (86 percent of the pre-pandemic level) visited Spain (link).
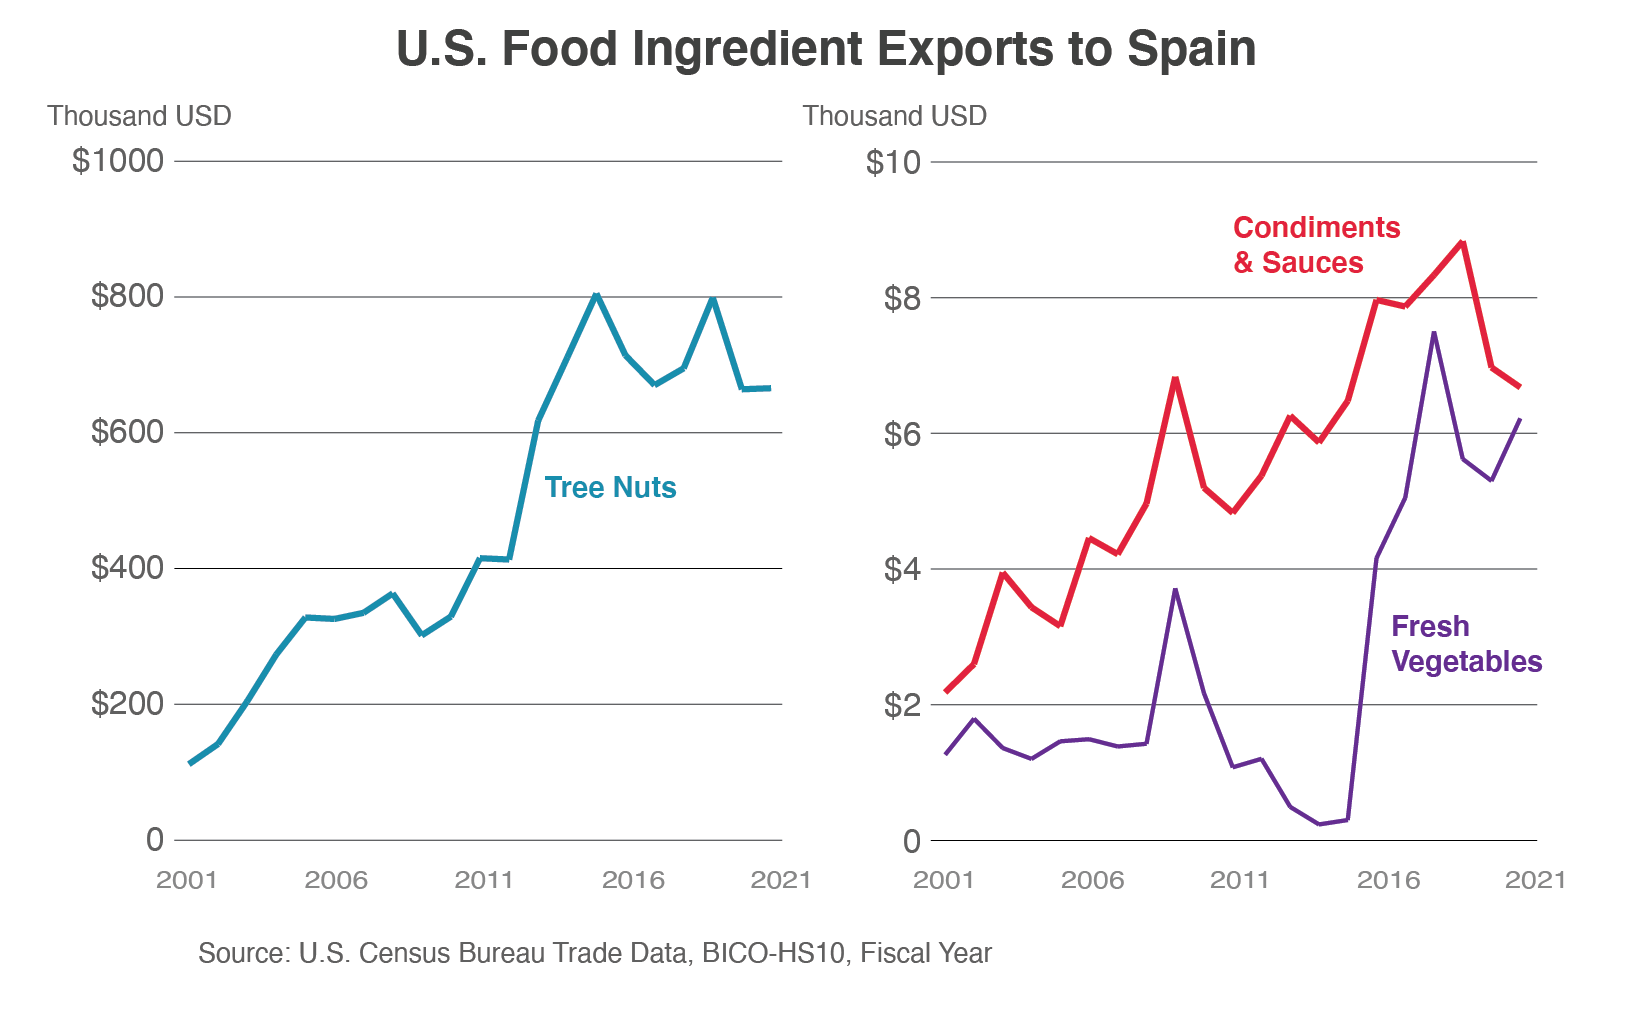
Along with tourism, Spain has one of the most competitive food processing industries in the EU. The Spanish food processing industry manufactures a wide range of products and provides more than 500,000 jobs, representing 21 percent of the total industrial workforce. Specifically, the industries include meat, fishery, milling, bread and pasta, fats and oils, and animal feed. The food-processing sector is known for quality, safety, and traceability of the food it manufactures. Also, the food processing sector serves mainly domestic consumers, accounting for 70 percent of total sales. Spain’s food industry relies on imported ingredients for many of its products, with many imported from the United States. For instance, U.S. exports of tree nuts, condiments and sauces, and fresh vegetables to Spain increased in value from 2016 to 2018 but cooled in recent years (see fig. 2).
Figure 2: U.S. Food Ingredient Exports Have Increased for 20 Years (2001-2021)

Best Prospects for Spain
Tree Nuts
During the COVID-19 pandemic, tree nut consumption increased in the EU due to consumer demand for healthy foods (see Table 2). In 2021, the EU was the top market for U.S. tree nut exports. Germany, Spain, and the Netherlands have been the most significant importers. Almonds, walnuts, and pistachios accounted for 72 percent of total Spanish tree nut imports globally, of which the United States is the main supplier for all three types. Spain has relied on tree nut imports as domestic production and sources from other EU member states have not met demand.
Table 2: European Union Tree Nut Consumption
Marketing Year, 1,000 Metric Tons
| Commodity | 2017/2018 | 2018/2019 | 2019/2020 | 2020/2021 | 2021/2022 |
| Almonds, Shelled Basis | 354,462 | 364,100 | 390,800 | 420,091 | 418,645 |
| Pistachios, Inshell Basis | 100,500 | 108,110 | 119,200 | 135,467 | 154,330 |
| Walnuts, Inshell Basis | 365,818 | 368,169 | 392,425 | 398,651 | 394,601 |
Source: USDA Production, Supply & Distribution (PS&D) Data
In Spain, the most significant tree nut consumers have been the food processing and snack industries. Tree nuts have multiple uses in the food ingredient industry. Shelled pistachios have been used by bakeries and food companies, while ice cream makers have preferred milled pistachios. European food manufacturers use walnuts primarily as an ingredient for manufacturing ice cream and confectionery products. In-shell almonds are mainly sold for fresh consumption and shelled almonds are used as a raw material for confectionery and bakery food companies. Almonds are used as an ingredient for the manufacturing of marzipan, nougat, and turron, a Spanish Christmas confection.
The demand in Spanish tree nut imports varies by nut type. For instance, total Spanish almond imports from the world were down 11 percent from 2020 to 2021, while walnut imports were up 3 percent during the same timeframe. Despite the varied growth rates, all three tree nuts remain important in the food ingredient sector. Spain continues to be the leading European importer of almonds.
A key constraint of exporting tree nuts to Spain is complying with EU import requirements for aflatoxins, especially in almonds and peanuts. Aflatoxins are naturally occurring mycotoxins produced by certain kinds of fungi that are found throughout the world. Countries, including the United States, regulate the action level of aflatoxin concentration in domestic and imported foods. The EU, however, has set a maximum level for aflatoxin lower than that of the United States, which poses challenges for U.S. pistachio exporters. Although the United States is the top tree nut supplier in the Spanish market and has 55 percent of the market, the United States faces strong competition from other EU member states, as well as Chile, Turkey, and Iran.
Pulses
Pulses are a traditional ingredient for Spanish cooking. Beans, chickpeas, and lentils are used in many family dishes, including Caldo, traditional lentil, chickpea, or bean stews (such as Fabada Asturiana), and hummus. Spanish consumers have sought out pulses during the COVID-19 pandemic when they were spending time at home, as pulses are seen as a healthy and alternative source of protein. Spain is a net importer of lentils, chickpeas, and dry beans due to a shortfall in domestic production. In 2021, Spain imported $194 million of pulses from the world. The United States is a top supplier of pulses to Spain. A key constraint since June 2018, however, was the EU’s 25 percent retaliatory tariff on U.S. navy and kidney beans. The removal of these tariffs on January 1, 2022, reopened the market for expanded opportunities for U.S. kidney beans. Argentina, Canada, Mexico, and other EU members are competitors in the Spanish market.
Sunflower Seeds
In 2021, Spain imported $302 million of sunflower seed products. The top supplier is France, followed by China and Romania. In Spain, sunflower seeds are mainly crushed for protein meal and vegetable oil; however, a portion of seed is also used in confectionary as well as consumed as snacks. Exporters from the United States can find opportunities since sunflower seed production in Spain is insufficient to meet domestic demand. According to Euromonitor, there is a strong tradition of snacking on nuts and seeds, including sunflower seeds. Snacks perceived as healthy will continue to remain popular as consumers continue to look for healthy eating options following the COVID-19 pandemic.
Sweet Potatoes
Demand for sweet potatoes has increased during the last 5 years. Spanish sweet potato imports increased from $2 million in 2017 to $13 million in 2021 from all sources. The Netherlands, the United States, and Portugal are top suppliers of sweet potatoes in Spain. The United States is the second-largest supplier and holds a 22 percent market share. Sweet potatoes from the Netherlands are originally from the United States and are re-exported to Spain.
Dog and Cat Food
Spain imported $511 million of dog and cat food products in 2021, up 27 percent from the previous year. Additionally, dog and cat food imports have had consistent growth for the last 5 years. The top suppliers of dog and cat food are the other EU member states, Canada, and the United States. Euromonitor mentioned that sales of pet care products have increased during 2022 due to a rising pet population in Spain and more owners opting to buy premium pet food. Additionally, more Spanish consumers are becoming health-conscious and paying attention to the nutritional needs of their pets.
Beer
As reported by Euromonitor, total beer volume sales (domestic and foreign) rose by 11 percent in 2021 to 3.7 billion liters. This increase is driven by the lifting of COVID-19 restrictions and more consumers drinking beer products at restaurants and bars. Low and non-alcoholic beers remained popular in 2021 as consumers continue to look for healthy alternative products. Domestic beer accounts for most of the total beer volume sales. According to reports, supply chain disruptions have affected international companies that export beer to Spain.
Despite the supply chain issues, Spanish beer imports reached $382 million from all sources in 2021, up 13 percent from the previous year. The top suppliers of beer are other EU member states (Belgium, France, Portugal), Mexico, and the United Kingdom. Beer import growth has been consistent during the last 5 years. The United States has less than 1 percent market share but exported at least $1.1 million of beer products to Spain.
Portugal: Demographics and Economic Trends
Approximately 10.2 million people live in Portugal, making it the 12th most populated country in the EU. Like Spain, the population has been aging, with Euromonitor reporting that the median age was 44.8 years. By 2030, this indicator will reach 49.4 years, the highest in Western Europe. According to the CIA World Factbook, the population is concentrated primarily along or near the Atlantic coast. Lisbon and Porto, the capital and the second largest city, respectively, are the main coastal cities. Portugal is a net agricultural importer and relies heavily on imports to supply its population. Total agricultural imports from the world went up $1.7 billion to $12.1 billion in 2021. Top agricultural imports include soybeans, corn, olive oil, and baked goods. Portugal receives most of its U.S. agricultural goods through Spain. With the freedom of movement and open borders in the EU, goods for both countries may enter a single port and then be shipped overland to a different member state.
Portugal is the 14th largest economy in the EU. Portugal’s economy had a strong start in the beginning of 2022; however, growth has cooled due to rising inflation and sharp increases in energy and food prices. Tourism and a sustainable labor market have continued to support Portugal’s economy. S&P Global estimates that the real GDP growth rate to be 5.5 percent as the tourism sector and inflows of EU funds will likely support economic growth. However, the real GDP growth rate for 2023 is forecast to decrease to 1.7 percent due to higher projected inflation.
U.S. Agricultural Exports to Portugal Are Down During COVID-19 Pandemic, but Opportunities Remain for Growth
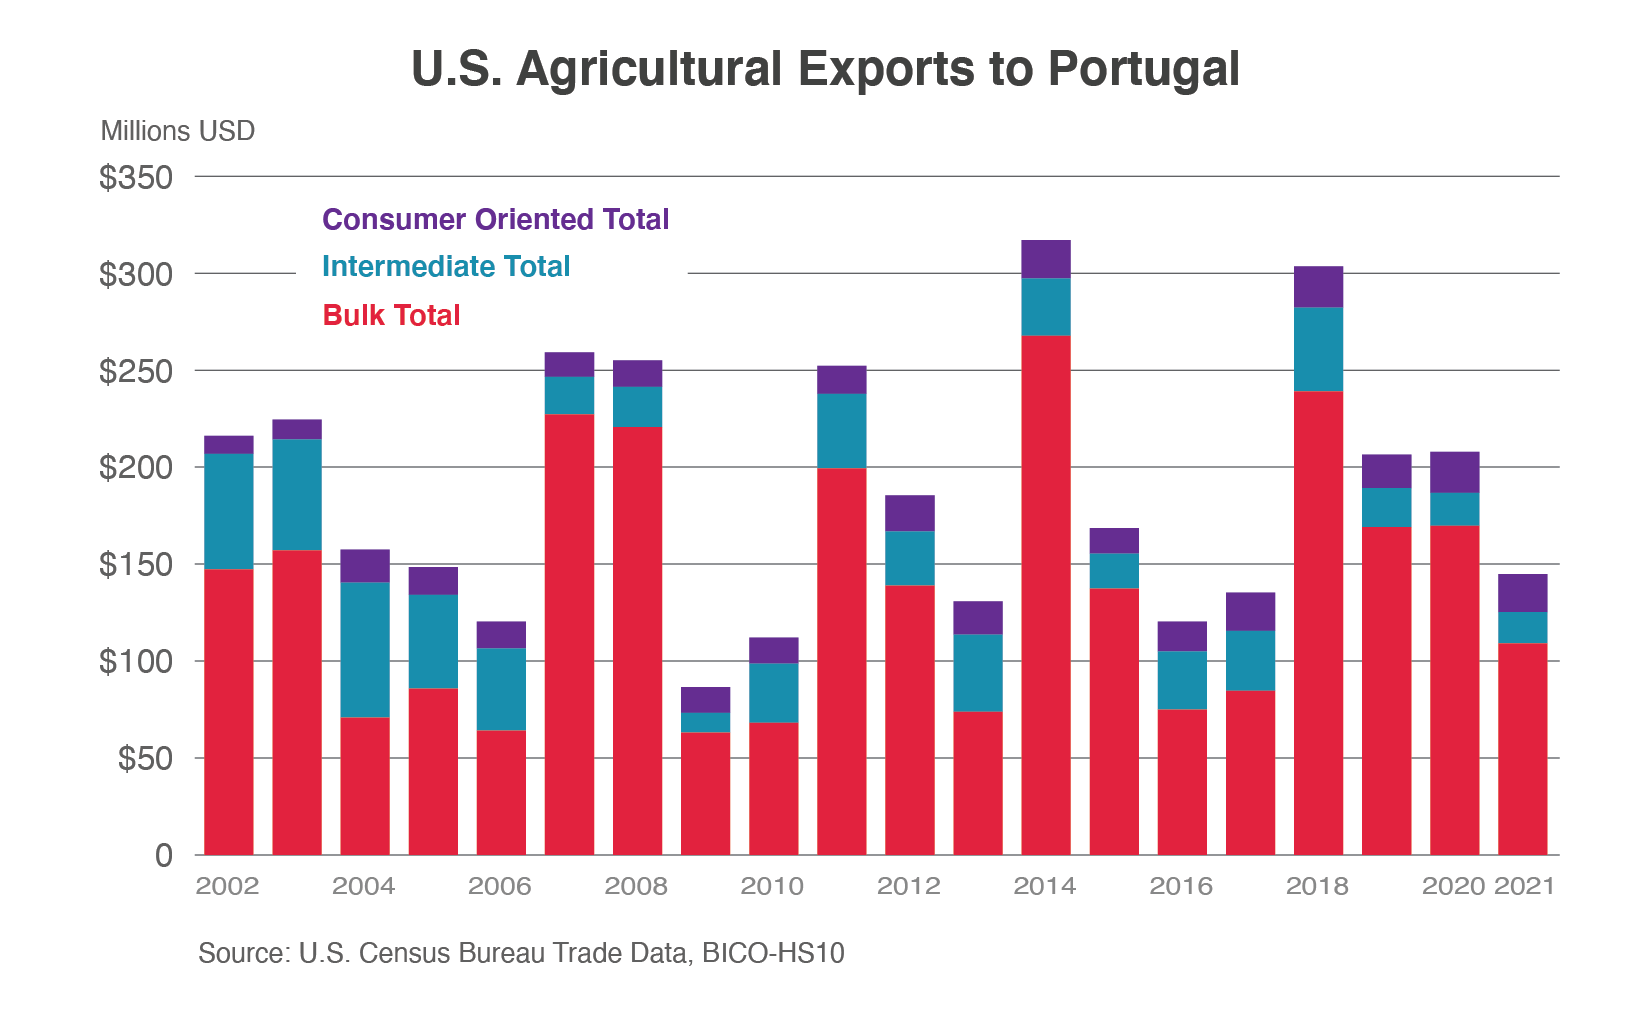
U.S. agricultural exports to Portugal have varied in recent years as the country moves towards the post COVID-19 economic environment. Overall U.S. agricultural exports to Portugal were down 30 percent in 2021. Bulk products accounted for more than 75 percent of total U.S. agricultural exports to Portugal and contributed to most of the overall decrease. Consumer-oriented product exports were down 8 percent since the last fiscal year and represented 13 percent of total U.S. agricultural exports. Tree nuts and distilled spirits account for most of the decrease. Also, intermediate goods declined by 27 percent as decreases in planting seeds more than offset the increases in feeds and fodders and hides and skins.
The food industry in Portugal is mostly small and medium-sized companies but represents a strategic sector for Portugal, putting particular emphasis on developing the exporter sector. The industry contributes to the Portuguese economy, adds jobs, and promotes regional development. Portuguese food processors are known for the quality, safety, and traceability of its products. The COVID-19 pandemic has limited the growth of the food industry. In 2021, however, the food industry remained resilient as Portuguese companies continued to strengthen their positions in the market and to rely on U.S. food ingredients.
Figure 3: U.S. Agricultural Exports to Portugal by Bulk-Intermediate-Consumer Oriented (BICO) Category, 2002-2021

Table 3: Top U.S. Agricultural Exports to Portugal
Value in Million Dollars
| Annual Year | Market Share | |||||||
| Top U.S. Ag Exports to Portugal | 2019 | 2020 | 2021 | 2019 | 2020 | 2021 | ||
| 1. Soybeans | 143 | 137 | 100 | 43% | 23% | 21% | ||
| 2. Cotton | 6 | 4 | 6 | 9% | 9% | 9% | ||
| 3. Dog & Cat Food | 3 | 5 | 5 | 2% | 2% | 2% | ||
| 4. Tree Nuts | 5 | 9 | 5 | 5% | 7% | 3% | ||
| 8. Planting Seeds | 6 | 3 | 5 | 3% | 2% | 3% | ||
| Total Agricultural Exports | 206 | 208 | 145 | 2% | 2% | 2% | ||
Source: U.S. Census Bureau Trade Data, BICO-HS10; Trade Data Monitor, LLC, BICO-HS6 for market share
Best Prospects for Portugal
Dog and Cat Food
Pet food from the United States enjoys a good reputation in Portugal. In 2021, Portugal imported $243 million worth of pet food products. Imports from the United States increased from $2 million in 2017 to $5.3 million in 2022. The United States competes mainly with other EU members, mostly Spain, France, and Germany. However, the United States is the top non-EU supplier of pet food. According to Euromonitor, pet ownership in dogs and cats has been increasing in Portugal. More young couples are obtaining pets before having children. Additionally, the COVID-19 pandemic has boosted demand for pets and sales of pet care products. Organic, raw, natural, and balance pet foods have been trending in the pet care market. Euromonitor estimated that pet food will continue to benefit from premiumization and innovation from brands and private labels.
Tree Nuts
Portugal is a reliable market for U.S. almonds, pistachios, and walnuts. In 2021, Portugal imported $4 million of tree nuts from the United States. Growth has been positive for the last 5 years (2017-2021). Total tree nut imports from the world increased from $94 million in 2017 to $114 million in 2021. The United States faces competition from other EU members, Chile, and Vietnam. Some of the tree nuts originally from the United States are imported through Spain.
Condiments and Sauces
Portuguese condiment and sauce imports increased from $59 million in 2017 to $86 million in 2021, up 47 percent. Spain, Germany, and the United Kingdom are top suppliers. Portugal imports mostly mixed condiments, ketchup, vinegar, and soy sauce. Imports from the United States have increased from $734,000 in 2017 to $990,000 in 2021.
Bakery Goods, Cereals, and Pasta
Imports from the world increased from $542 million in 2017 to $689 million in 2021. Products mostly include bread, pastry, cookies, and pasta. Growth has been consistent during the last 5 years. The top suppliers are Spain, France, and Germany. Imports from the United States totaled $850,000 in 2021. In a Euromonitor snacks report, Portugal is seeing a shift towards indulgent products, with some healthy benefits; for instance, more consumers are purchasing sugar-free biscuits and vegan snacks. Health, well-being, and sustainability will continue to be the main drivers of snack consumption in 2022.
Prospects for Agricultural-Related Products
In addition to agricultural products, U.S. exporters can find opportunities in exporting agricultural-related commodities.
Seafood Products
Seafood products are a staple in Spanish and Portuguese dishes, including paella and Polvo à Lagareiro. In 2021, Spain imported $8.8 billion of seafood products. Shrimp, octopus, tuna, and salmon are top seafood imports in Spain. U.S. seafood and fish products have a good reputation in Portugal. The United States competes with Morocco, other EU members, and Ecuador. Also, in the same year, Portugal imported $2.4 billion of seafood products. Top imports are cod, shrimp and prawns, and octopus. Other EU members, China, and Russia are top seafood suppliers in Portugal. Imports from the United States totaled $88 million and $14 million in Spain and Portugal, respectively.
Conclusion: Future of Trade with Spain and Portugal Remains Positive
Spain and Portugal are wealthy economies that should provide robust markets for U.S. agricultural exports. However, U.S. exporters should be aware of several non-tariff barriers to trade. For example, EU biotech labeling and traceability regulations can pose challenges to U.S. agricultural exports. The EU food and feed labeling regulations provide for a 0.9 percent threshold for the "adventitious," that is, accidental and technically unavoidable, presence of EU-authorized genetically engineered (GE) event in non-GE food or feed. Food or feed products containing trace amounts of GM product above 0.9 percent per ingredient must be labeled as “Contains Genetically Modified Organisms.” Along with regulations, U.S. exporters should also expect constant competition from other EU member states and suppliers that have a free trade agreement with the EU. The EU maintains more than 40 free trade agreements, covering at least 85 countries.
Despite these troublesome barriers to trade, U.S. food and agricultural products enjoy a good reputation for quality and reliability. Due to strong distribution channels, higher demand for healthy and innovative products, and strong tourism and food processing industries, Portugal and Spain offer the potential for increasing their imports of agricultural products from the United States, including tree nuts, condiments and sauces, pulses, sunflower seeds, cat and dog food, and beer.
