Opportunities for U.S. Agricultural Exports to Southern Asia
Printer-friendly PDF (564.05 KB)
Executive Summary
South Asia, which includes Afghanistan, Bangladesh, Bhutan, India, Maldives, Nepal, Pakistan, and Sri Lanka, accounts for 24 percent of the world’s population, with 1.84 billion people in 2019. Over the past five years, U.S. agricultural exports to the region have grown 85 percent, from $2.30 billion in 2015 to $4.25 billion in 2019, led by cotton, tree nuts, soybeans, and dairy products. U.S. bulk commodities are being purchased by large companies in South Asia that recognize the value of U.S. products. In addition, the region’s expanding middle class and increasing number of households with disposable income, combined with growing demand for protein products, makes it a promising market for imports of intermediate and consumer-oriented goods from the United States. Careful attention to changing consumer demands remains key for U.S. businesses to take advantage of the region’s import growth potential.
U.S. Export Growth & Macroeconomic Considerations
Among the U.S. commodities that have seen significant sales growth in South Asia is cotton, with exports up 180 percent in the past five years, from $308 million in 2015 to $864 million in 2019. The COVID-19 pandemic’s impact on the region’s textile industry softened demand for U.S. cotton exports in 2020, but in the long term South Asia will remain a significant importer of cotton, especially as textiles and value chains continue to shift from China to the region. U.S. tree nut exports to the region grown 35 percent over five years, from $617 million in 2015 to $833 million in 2019, peaking at $1.06 billion in 2018.
According to World Bank data, South Asia’s population grew at an annual rate of 5 percent between 2015 and 2019. In 2020, the region’s GDP is projected to decline by 7.7 percent as a result of COVID-19. However, going forward, Euromonitor data show promising growth in the number of households with disposable income greater than $10,000 annually, including a projected increase from 2019 to 2024 of 26 percent in India, 68 percent in Bangladesh, and 27 percent in Sri Lanka. While generally not considered part of the South Asia region, Burma is on a similar trajectory with expected growth of 69 percent by 2024. While these percentage increases are impressive, the growing middle class still remains a small percentage of these countries’ populations. Still, the expansion of the existing middle class and households with expendable income bode well for increased U.S. agricultural exports of intermediate and consumer-oriented goods.
Bangladesh
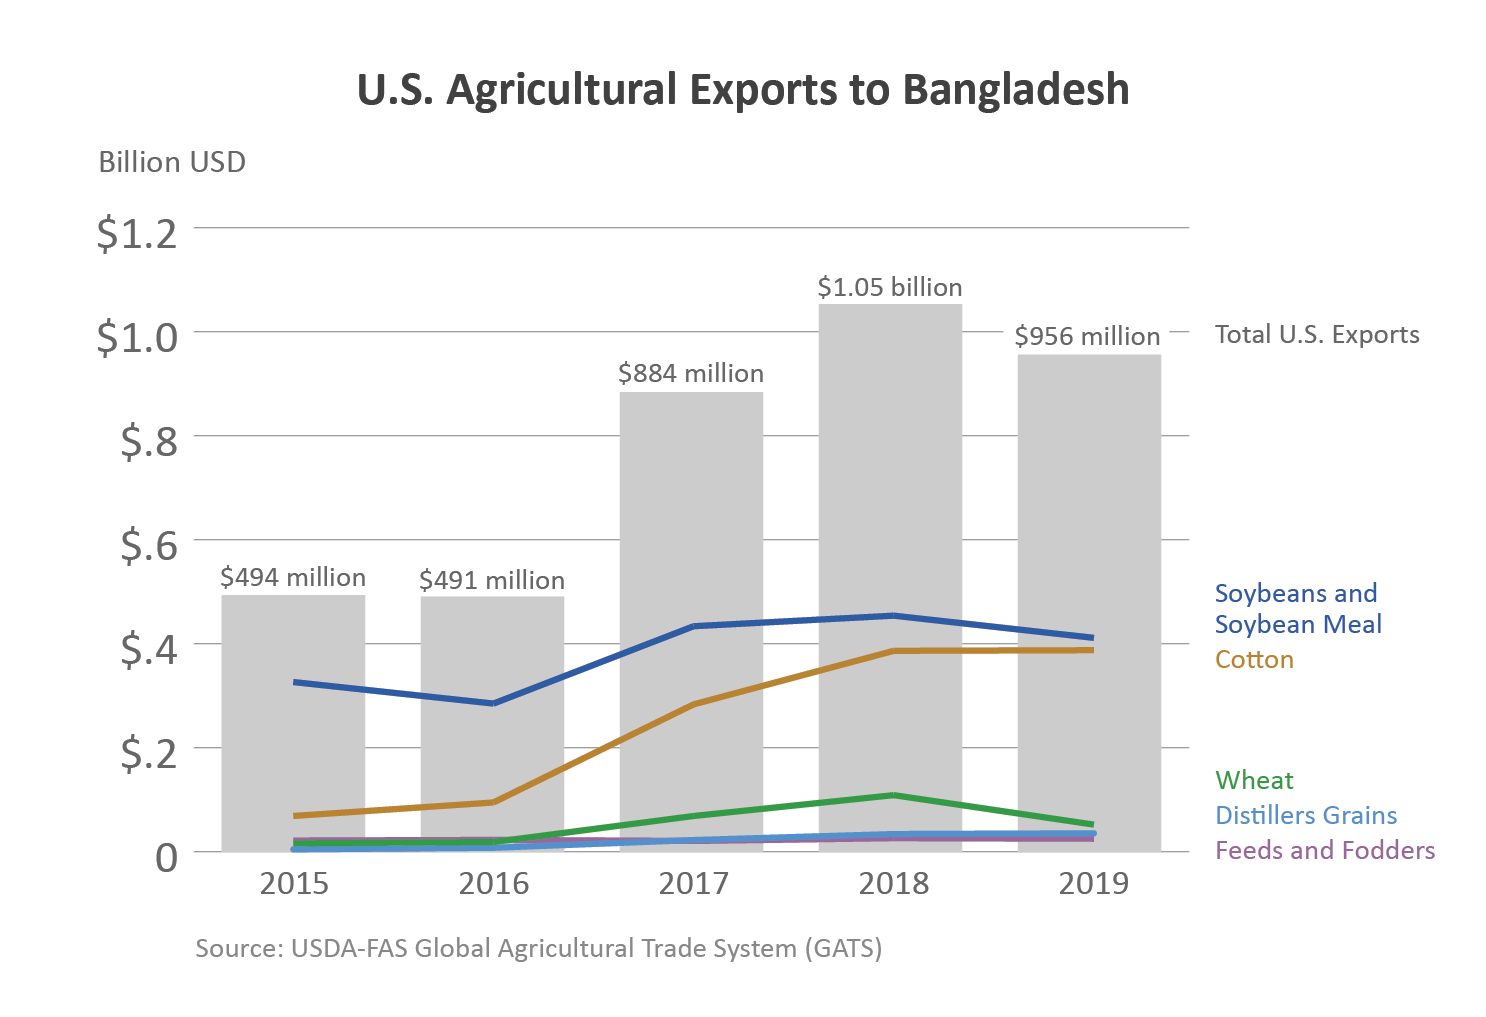
According to the World Bank, Bangladesh’s GDP has grown more than 5 percent annually since 2005. The country has a young population that is increasingly globally connected through technology and Internet use. Annual U.S. agricultural exports to Bangladesh grew 93 percent over five years, from $494 million in 2015 to $956 million in 2019, and are on track to surpass $1 billion in 2020. Following the Rana factory collapse in 2013, Bangladesh’s textile industry took measures to improve worker safety and implement internationally recognized human rights standards. While it still has a long way to go, Bangladesh has made progress and retailers are returning to the market, leading to increased demand for cotton. (For additional information, see the FAS report Bangladesh: Cotton and Products Annual 2020.) Tree nuts also show potential for growth despite only being a $1.2-million export market for the United States in 2019.
Burma
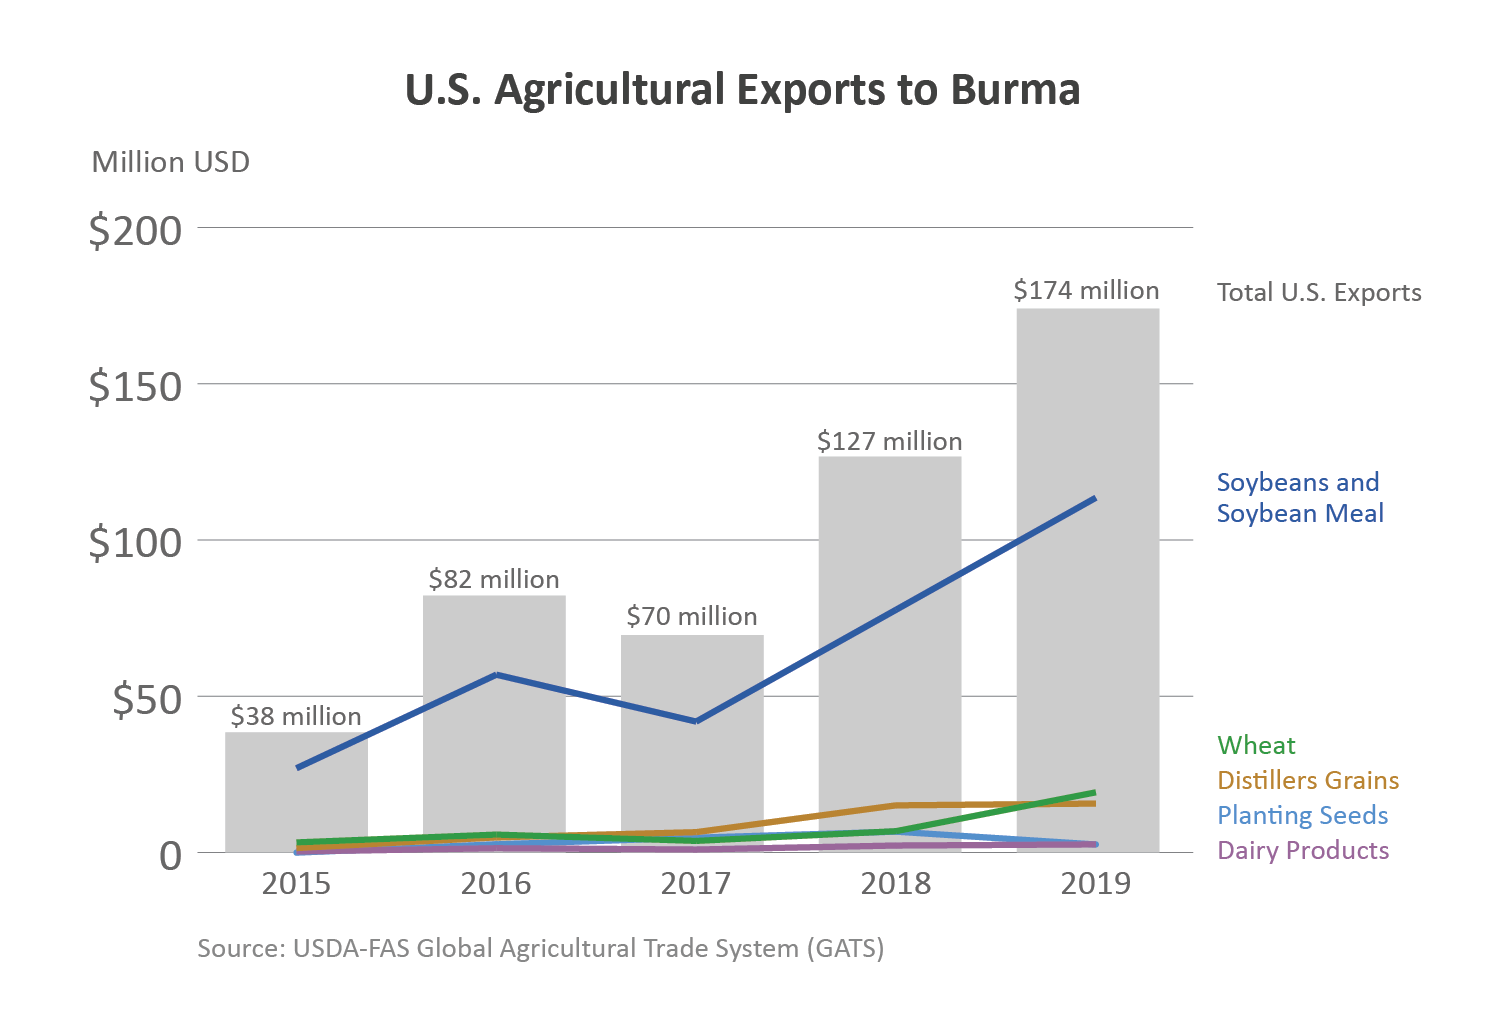
Burma is experiencing rapid economic growth as it opens its market to new international food cuisines and cultures. IHS Markit projects that Burmese GDP will grow 27.6 percent by 2024 to more than $98 billion annually. Burma imported $2.1 billion of agricultural products in 2019, with the United States as its fifth-largest supplier. The United States is relatively new to the Burmese market. Over the past five years, U.S. agricultural exports to Burma have almost quintupled to reach a record $174 million in 2019, led by livestock feed ingredients, wheat, dairy products, prepared food, fresh fruit, and processed vegetables. Burma just reduced the list of products that require import licenses by 689 tariff lines. (For more information, see the recent FAS report Burma Reduces List of Products that Require Import Licenses.)
India
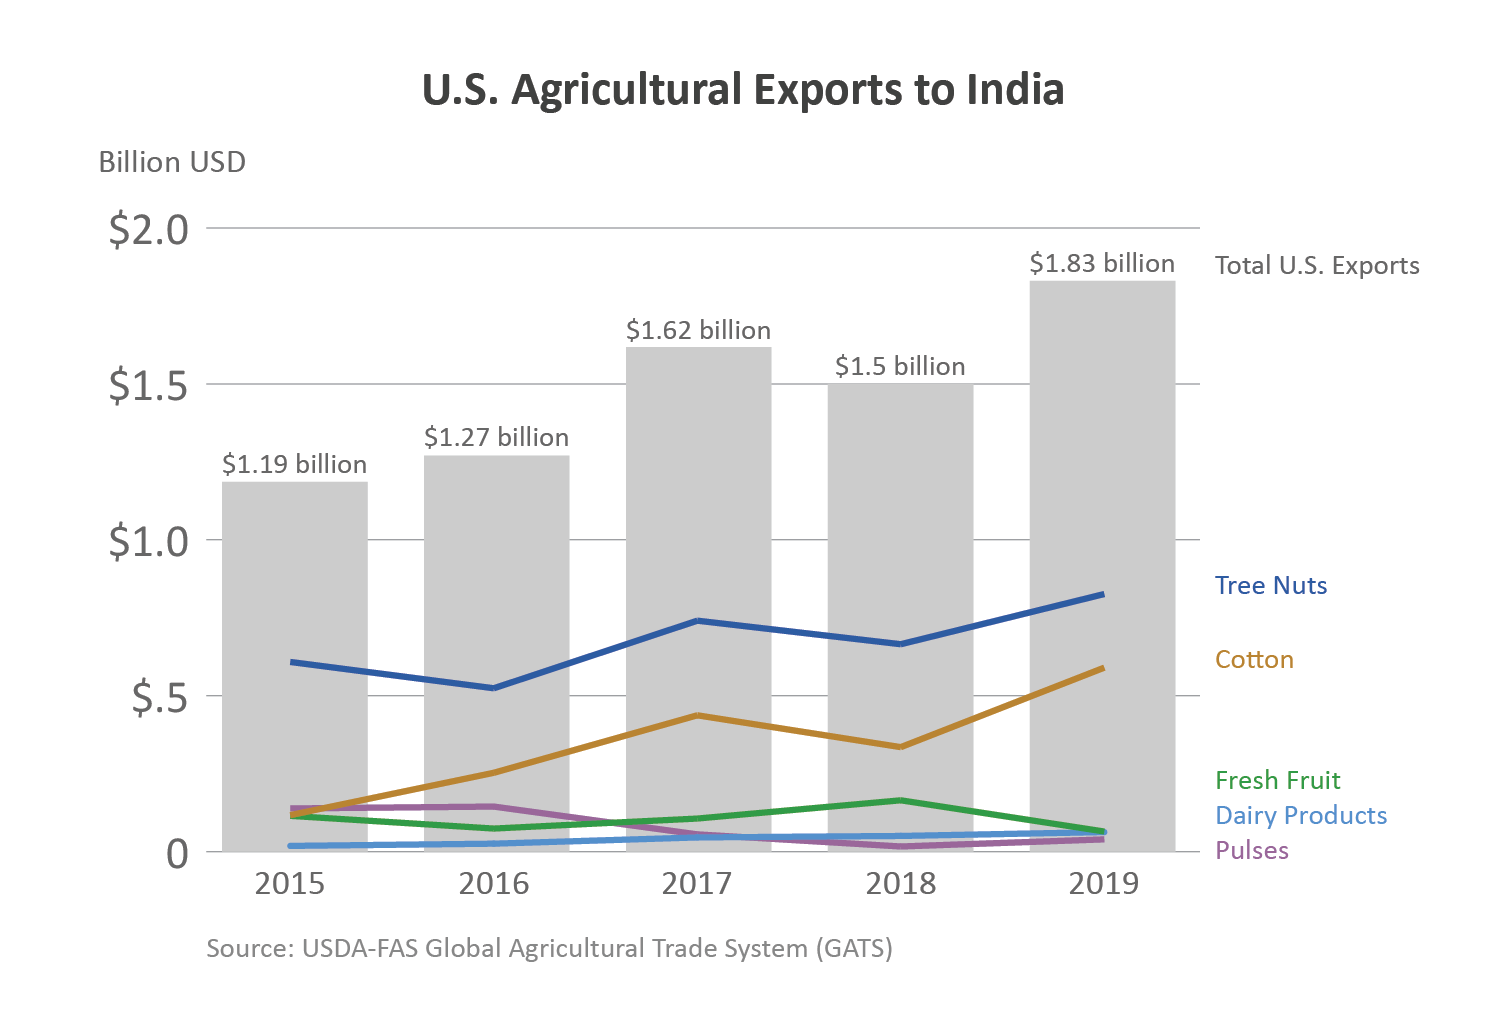
India is the second-most populous country in the world and the 14th-largest market for U.S. agricultural exports. India’s agricultural imports from the United States increased 69 percent over the past five years, from $1.3 billion in 2015 to $2.2 billion in 2019, led by tree nuts, cotton, and ethanol. (For more information about U.S. tree nut exports to India, please see the FAS report India: Tree Nuts Annual 2020.) India imports more than $22 billion in agricultural goods each year and consumer demand for “immunity-boosting” foods is rapidly increasing. In the last five years, middle-class consumers, especially among India’s youth, have developed awareness of the benefits of eating healthy, leading to increased consumption of perceived health foods. More than 65 percent of India’s population is 35 years old or younger, which makes it one of the youngest countries in the world.
Sri Lanka
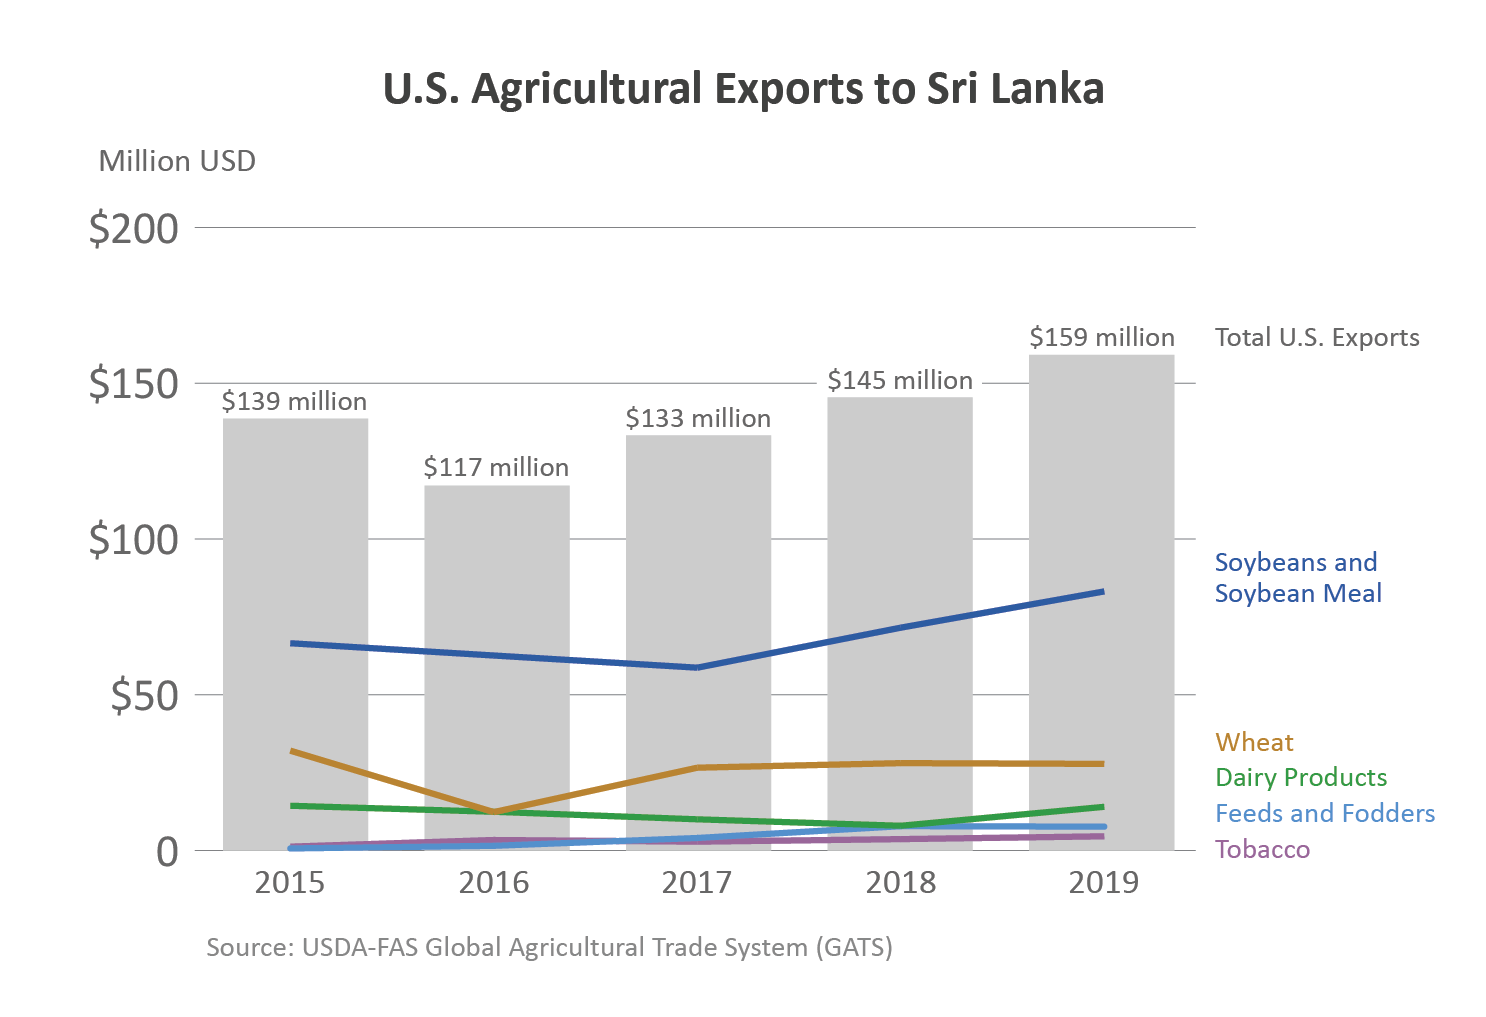
Sri Lanka has emerged as a small, yet growing, market for imported consumer food products and has the highest per-capita GDP in South Asia. In the past five years, U.S. agricultural products exports to Sri Lanka have increased by 15 percent, to reach $159 million in 2019, led by soybean meal, wheat, and dairy products. In addition, Sri Lanka’s tourism and hospitality sectors, new restaurants, and upscale food retailers are creating avenues for imported high-end and consumer-oriented goods.
Nepal
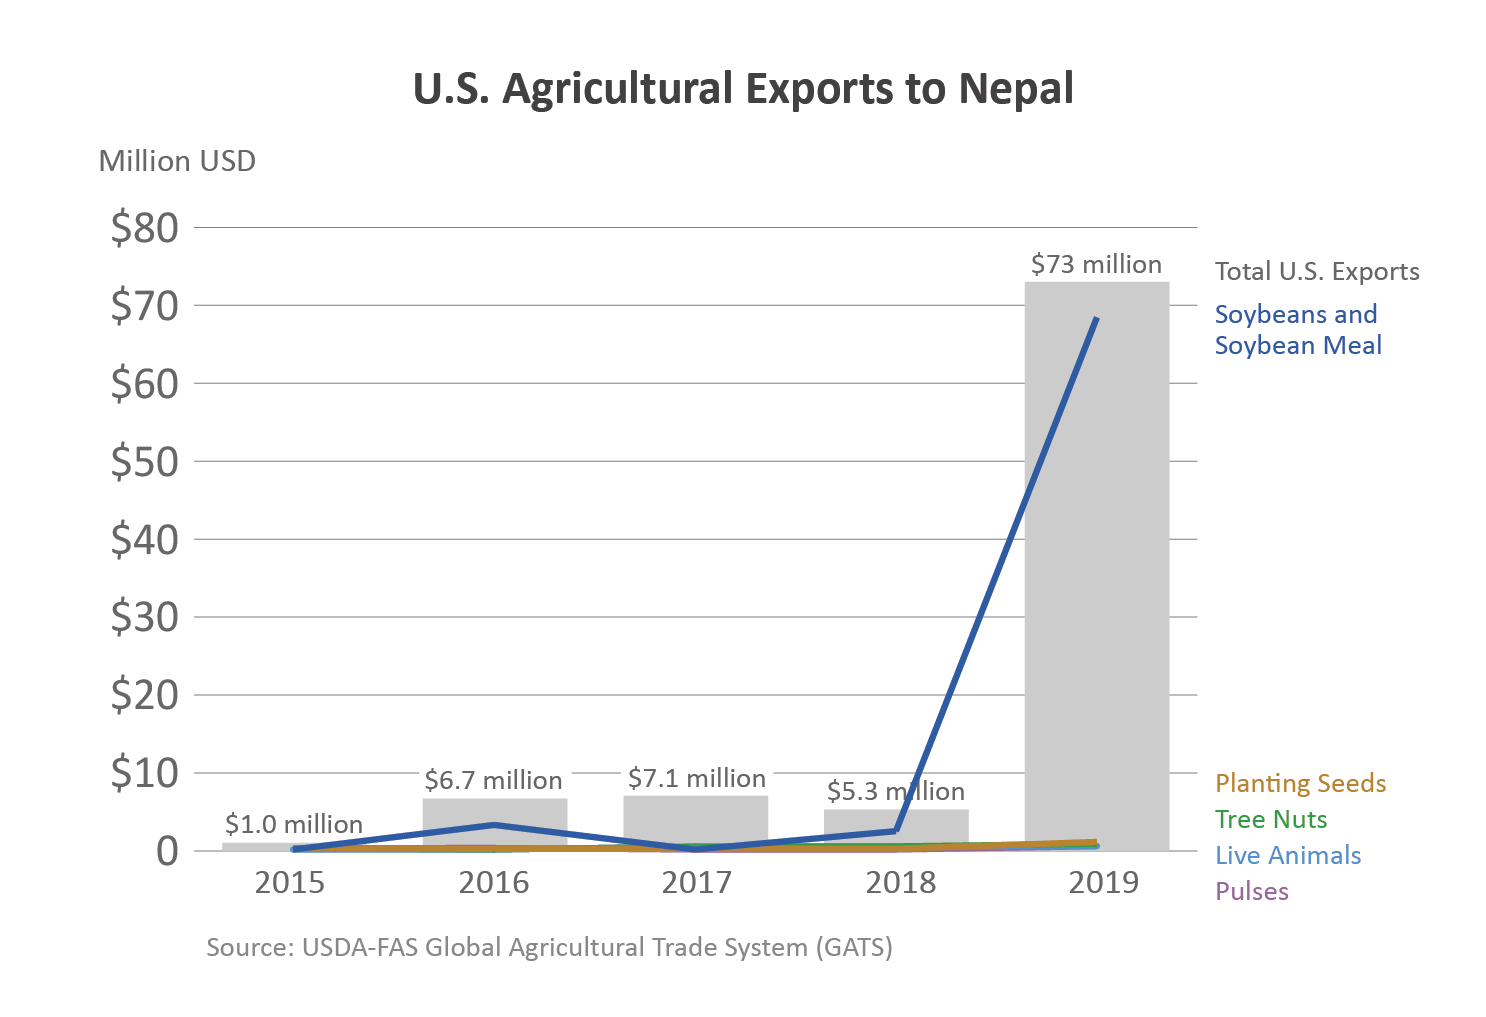
The United States has benefitted from a recent surge in exports to Nepal. In 2019, U.S. agricultural exports to Nepal totaled $73 million, a nearly elevenfold increase over the previous year thanks to higher sales of soybeans, soybean meal, and pulses. Nepal relies on tourism and a burgeoning hospitality sector, which has been negatively affected by the COVID-19 pandemic. In a post-COVID environment, tourism is expected to rebound, as is demand for imported consumer-oriented products including packaged food products and health foods such as tree nuts.
Looking Ahead
Cotton, soybeans, soybean meal, and tree nuts remain the primary U.S. exports to South Asia. With the region’s growing population and sizeable young demographic, there are continued opportunities to expand U.S. agricultural exports. Bangladesh and Burma look particularly promising, while India’s various trade restrictions limit market access for U.S. foods, including most animal and livestock-derived products. Burma’s recent incorporation into the world economy and astonishing economic growth in the last decade give it unique potential for future export growth.
With the global economy’s expected recovery from the COVID-19 pandemic in the latter portion of 2021 and beyond, demand for cotton is expected to rise. South Asia remains a prime destination for U.S. cotton export growth as textile manufacturers shift away from China. Feed grains such as corn and distillers’ dried grains with solubles also show promise. The demand for imported food and agricultural products is improving, and packaged, protein-rich, high-value food products, fresh fruits, and tree nuts are among the most significant market segments. These rapidly growing markets will continue to provide opportunities for U.S. food and agricultural products despite persistent challenges including high tariffs, changing regulatory environments, technical and phytosanitary barriers, and competition from foreign and domestic suppliers. In order to expand U.S. exports to these growing markets, exporters should pay careful attention to changing consumer demands.
