China and Hong Kong: Challenges and Opportunities
Contact:
Printer-Friendly PDF (486.41 KB)
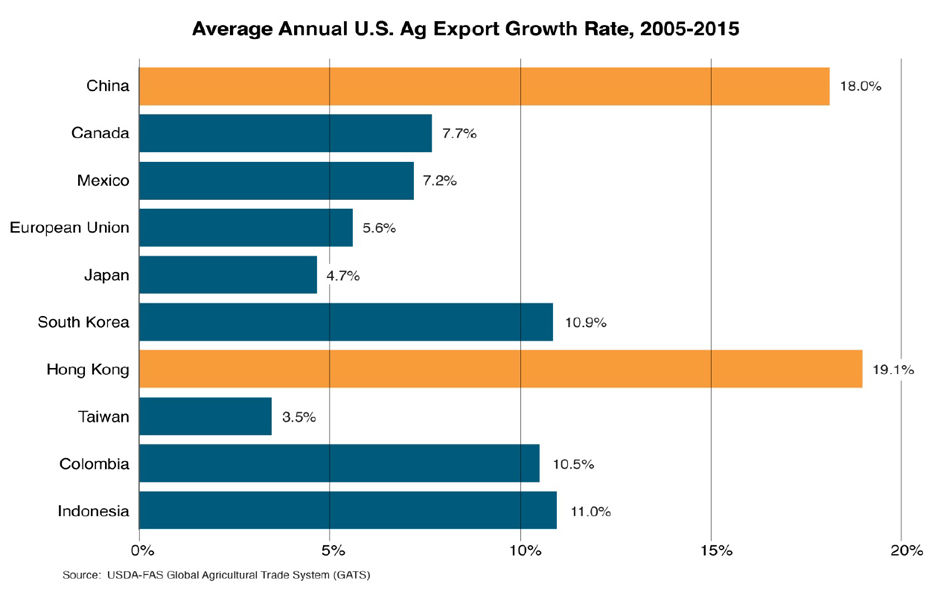
At a combined $23.8 billion, China and Hong Kong represent 18 percent of U.S. agricultural exports to the world, up from 10 percent just a decade ago. Among the top U.S. agricultural markets, both China and Hong Kong have had the highest average annual growth rate over the last decade. More recently, however, U.S. exports to both markets have slowed or even declined, as China’s economy undergoes transition, and a massive buildup of government reserves of agricultural products overshadows the market. In the near term, U.S. suppliers will continue to face challenges as China’s economy adjusts. The long-term outlook remains positive, as the divergence between China’s growing demand and its constrained production widens, creating opportunities for U.S. exports.

China: Market Overview
Since joining the World Trade Organization (WTO) in 2001, China’s agricultural imports have grown more than tenfold, propelled by economic growth, rising household income, land scarcity, increasing urbanization and changing diet. China is now the world’s third largest agricultural market, after the EU and the United States. The average Chinese diet changed to include more meat, edible oil, dairy and processed foods, while grain consumption declined. According to China’s Bureau of Statistics, between 2000 and 2012, urban household per-capita consumption of poultry meat nearly doubled, milk rose 40 percent, and pork and vegetable oil increased 27 percent and 12 percent, respectively.
China produces most of the meat it consumes, and the dietary change drew more of the country’s land into production of feed, as evidenced by corn acreage surpassing rice area in recent years. However, domestic feed supplies have been unable to meet soaring demand, causing imports of soybeans and other feed ingredients to surge. Between 1990 and 2015, production of meat and poultry nearly tripled, with pork dominating more than two-thirds of the output. Concurrently, demand for soybeans (mostly for meal and oil) expanded more than 900 percent during the last 25 years, while soybean production only grew 11 percent. To bridge the rapidly-widening gap between domestic production and soaring consumption, imports grew from virtually nothing in 1990 to 82 million metric tons in 2015, which was greater than 60 percent of total world trade.

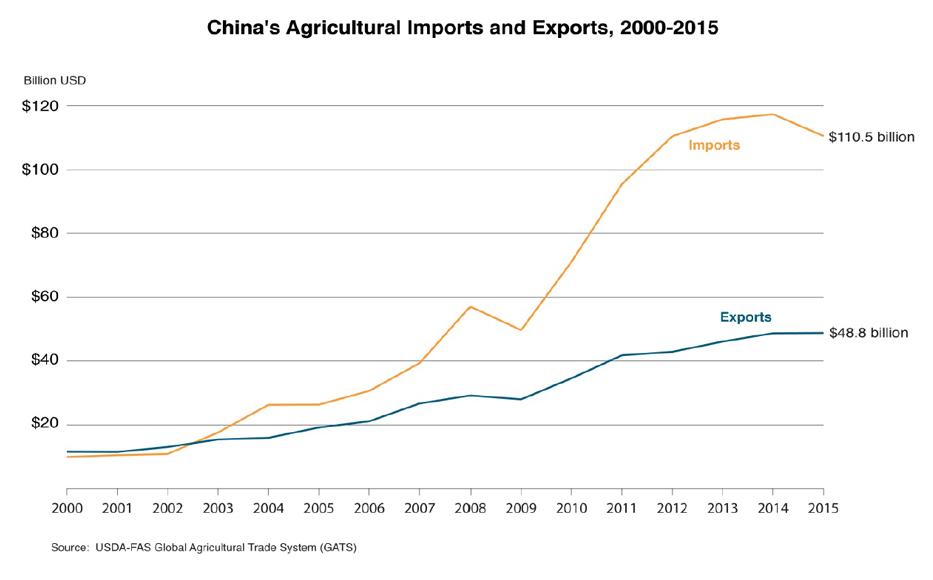
Although self-sufficiency, particularly for strategic commodities such as wheat and rice, remains paramount to the Chinese government, economic reforms and market liberalization have led to booming imports and exports. With 40 percent of the world’s farmers and only 10 percent of its arable land, China’s agricultural economy has benefited greatly by importing land-intensive bulk and intermediate commodities and exporting labor-intensive, consumer-oriented products. Besides soybeans, China’s major imports also include vegetable oils, grains and feeds, cotton and hides and skins. Its largest exports consist of processed fruit and vegetables, fresh fruit and vegetables, prepared red meat and snack foods. Since its WTO accession, growth of China’s agricultural imports has far outstripped that of exports, resulting in a widening trade deficit.
The United States is China’s Leading Supplier
The United States is the largest supplier to China with a 22-percent market share. Feed ingredients such as soybeans, coarse grains, distillers dried grains with solubles (DDGs), and other feeds and fodders constitute more than three-fourths of U.S. exports to China. These commodities destined for the livestock and poultry industries have been important drivers of China’s impressive import growth, leading China to become the largest U.S. agricultural market in 2010.
In addition to bulk and intermediate products, U.S. exports of consumer-oriented products to China also expanded rapidly. Since 2005, U.S. exports of dairy, pork, tree nuts and wine and beer to China all experienced triple-digit growth.
- Dairy exports grew more than 600 percent, led by nonfat dry milk and whey. China is now the third largest U.S. dairy market.
- Exports of U.S. pork and pork products to China increased nearly 400 percent over the last decade. (China has periodically rejected U.S. pork exports due to the presence of ractopamine, a feed additive that promotes lean muscle growth in swine. In recent years, volatility in the Chinese pork industry, due to disease outbreaks and environmental regulations, has led to higher domestic prices and expansion in U.S. exports.)
- Exports of U.S. tree nuts to China more than quadrupled since 2005, with almonds and walnuts leading the growth.
- While the U.S. wine and beer market share in China is relatively small, at 3 percent, value of sales grew nearly ten-fold in just 10 years. China is the world’s fastest growing market for wine and beer.
| U.S. Agricultural Exports to China, CY 2015 | |
| Product | Value (Billion USD) |
| Soybeans | $10.52 |
| Coarse grains | $2.27 |
| Distillers Dried Grains | $1.63 |
| Hides and Skins | $1.27 |
| Cotton | $0.86 |
| Other Feeds and Fodders | $0.71 |
| Dairy | $0.45 |
| Pork | $0.43 |
| Tree Nuts | $0.21 |
| Other | $1.91 |
| Total | $20.26 |
| Source: USDA-FAS Global Agricultural Trade System (GATS) | |
Other major agricultural suppliers to China include Brazil (18 percent), the EU (11 percent) and Australia (7 percent). About 85 percent of Brazil’s exports to China consist of soybeans, and Brazil surpassed the United States in 2013 as China’s largest soybean supplier. The depreciation of the Brazilian Real in recent years has further enhanced Brazil’s competitiveness. The EU dominates exports of pork, wine and beer to China, while Australia is China’s top supplier of wool and beef, and is also competitive in cotton and hides and skins.
Challenges Facing U.S. Exports
U.S. agricultural exports to China peaked in 2012 at $25.9 billion and have declined since; current year-to-date shipments are down 26 percent from last year. China’s slowing economy and bulging stocks are key factors for the decline, as well as a strong U.S. dollar, making American products relatively more expensive. In recent years, China’s restructuring toward a more consumer-oriented economy has led to a slowdown of GDP growth, which is expected to be 6 percent this year, down from 10.6 percent in 2010 and the lowest rate since 1990.
China’s policy to support producers’ income through minimum purchasing prices has led to stock-piling of wheat, rice, corn, cotton and other products in state reserves. Corn and cotton stocks both amounted to more than half of the world’s total. To dispose of the large corn stocks, the government auctions off corn at below acquisition cost, while discouraging imports of corn and corn substitutes with various measures favoring utilization of domestic grains. Cotton imports have also declined sharply. Since early 2014, the U.S. dollar has appreciated against the Chinese Yuan and many U.S. competitors’ currencies, most notably the Brazilian Real, making U.S. exports less competitive.
Although China accepts that imports are necessary to help meet surging demand, it does not hesitate to use border measures and other tools to control import flows to protect domestic interests. Exports of DDGs from the United States are currently facing a new round of anti-dumping investigations, after China launched an earlier investigation in 2010 that was subsequently dropped in 2012. These actions create uncertainties for traders and negatively affect U.S. exports. In addition, the Chinese market has remained closed to U.S. beef since the December 2003 discovery of bovine spongiform encephalopathy (BSE) in a dairy cow in Washington State. China has also banned all imports of U.S. poultry since January 2015, following the discovery of highly pathogenic avian influenza (HPAI) in several U.S. states. Finally, China’s 2015 Food Safety Law and the Facility and Product Registration Requirement for all overseas feed and food manufacturers could pose additional scientifically and legally unjustifiable barriers on trade. At a minimum, the myriad laws and measures are expected to raise the transaction cost of doing business in China.
China’s contradictory approach toward biotechnology is another hurdle continually facing U.S. exports. China is the world leader in genetically modified (GM) rice research, and the latest Five Year Plan features prominent support for biotechnology. Yet, officials have been reluctant to legalize the commercial cultivation of GM rice or any of the other crops it has reportedly developed. Currently, the only commercialized GM crops cultivated in China are cotton and papaya. Meanwhile, China’s regulatory system, characterized by lack of transparency and predictability, has been slow to approve new domestic biotech products for cultivation or foreign products for imports. There are currently eight biotech products pending final regulatory approval, some of which were submitted for review as long ago as 2011.
China is also upgrading its inspection and quarantine system in ways that could hinder U.S. exports. China is adopting new requirements for traceability, exporter registration and strict controls on unapproved feed additives, weed seeds and foreign matter in cargoes that could be a challenge for U.S. exporters. On the other hand, China is also opening new entry points with inspection and testing facilities in central and western provinces to accommodate new demands for imports beyond the relatively wealthy coastal provinces.
In an effort to reduce risks of potential embargos and give its importers greater latitude to negotiate better prices, China has embraced a strategy to diversify its import suppliers through free trade agreements (FTAs) and import protocols. China has implemented 13 FTAs and is negotiating eight more. As the largest agricultural exporter, the United States faces increased competition for many products. According to a USDA Economic Research Service report, when U.S. corn exports to China began to increase in 2011 and 2012, China rushed through the approval process to establish corn import protocols with Argentina and Ukraine (link), truncating a typically years-long process into just a few months. Similarly, when U.S. sorghum exports to China soared in 2013 and 2014, China promptly approved sorghum imports from Argentina.
Hong Kong: Market Overview
With more than 7.2 million people packed into 426 square miles, Hong Kong relies on imports for more than 95 percent of its food supplies. Its location, free port status, and role as a regional purchasing and distribution center enabled Hong Kong to become a major transshipment hub for other Asian destinations. Last year, Hong Kong’s food and beverage imports totaled $21.6 billion, with the EU, the United States, China and Brazil as its largest suppliers. Main imports include beef, pork, fresh fruit, poultry and tree nuts. Hong Kong re-exported $7.7 billion, or about one-third of its agricultural imports, chiefly to China and Vietnam.
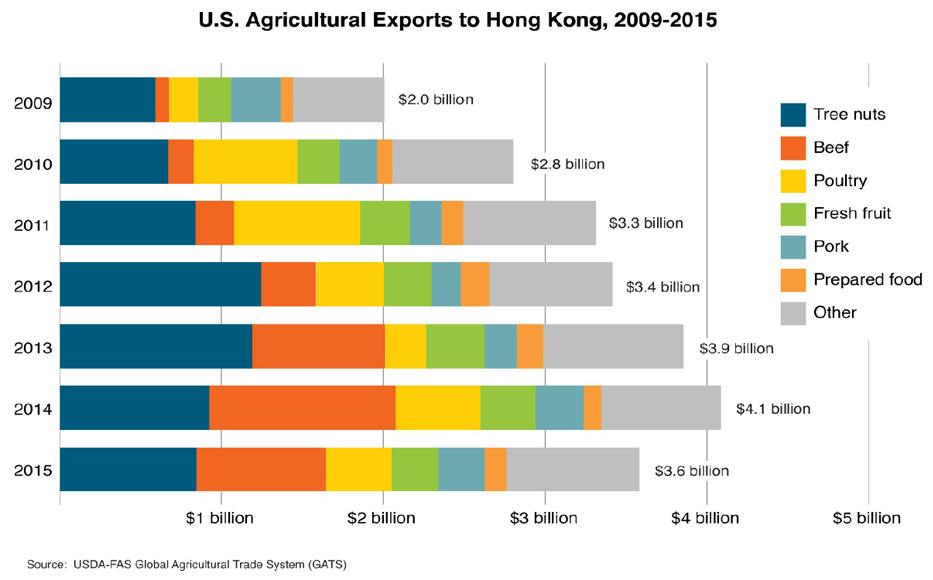
Hong Kong is the seventh-largest U.S. agricultural market, with sales of $3.6 billion in 2015. In contrast to China, where more than 70 percent of U.S. exports are bulk commodities, the vast majority (over 90 percent) of U.S. exports to Hong Kong are high-value, consumer-oriented products. Tree nuts, beef, poultry and fresh fruit lead U.S. agricultural exports to Hong Kong.
- Hong Kong is the second-largest market for U.S. tree nuts (after the EU), with sales of $845 million in 2015. The United States dominates the tree nut market with a share of nearly 60 percent. Hong Kong is one of the fastest-growing markets for U.S. beef. In just five years, the territory climbed from ninth place to the third-largest market for U.S. beef and beef products (after Japan and Mexico), with sales reaching a record $1.2 billion in 2014. The United States expanded its market share from 13 percent in 2010 to 32 percent last year.
- Hong Kong is the third-largest poultry market for the United States, with sales exceeding $400 million in 2015.
- The Hong Kong fresh fruit market is also the fifth largest for the United States.

With per-capita income slightly higher than the United States, Hong Kong is a sophisticated and mature market where demand for high-value products will continue to grow. As a major transshipment hub, its import growth is also tied to market development in neighboring countries, such as China and Vietnam, which helped to fuel the trade growth in recent years. However, as demand from China and Vietnam slows, so has Hong Kong’s agricultural imports, with U.S. agricultural imports down 12 percent in last year.
Outlook
As China’s overall economy is undergoing structural transition, the agricultural sector is also at a crossroads. Authorities in China hope to transform agriculture into a more efficient, green and capital- and technology-intensive sector. Domestic support policies in recent years have led to inefficiency and market distortions. Earlier this year, China began abandoning price support for all commodities except wheat and rice. Authorities are experimenting with new approaches to subsidizing farmers. In the short term, bulk imports will be under pressure as China digests its glut of grains and cotton. In the long term, rising food and feed demand, lagging growth in domestic supply, competition for land use from urbanization and industrialization, and increasing cost of labor and inputs will lead to higher prices and surging demand for imports. The United States, with its rich land endowment, is well suited to supply this demand.
In addition to bulk and intermediate products, demand for imported consumer-oriented products is expected to grow rapidly. Even with a slowdown in its GDP growth, China is still projected to have one of the fastest economic growth rates in the world and the country is expected to add more than 160 million middle class households in the coming decade. This means rising demand for meat, dairy and other high-value food and beverages. Meanwhile, domestic livestock and dairy production is under increasing pressure from shortage of capital investment, rising feed cost and lack of land. Rising land values, especially in coastal regions, combined with stringent enforcement of environmental regulations, have led to closures of swine operations and tighter pork supplies. At the same time, the government is also reducing support to swine producers in an effort to promote a more market oriented system. Prices of meat and dairy are expected to increase, creating market opportunities for the United States.
Hong Kong will continue to be a vital hub for U.S. agricultural products. Its steady economic growth and role as a regional transshipment center and distribution powerhouse, combined with rising demand from the Mainland, will make China and Hong Kong a dynamic market duo in the years to come.
