Opportunities for U.S. Consumer-Oriented Products in Peru
Contact:
Link to report:
Executive Summary
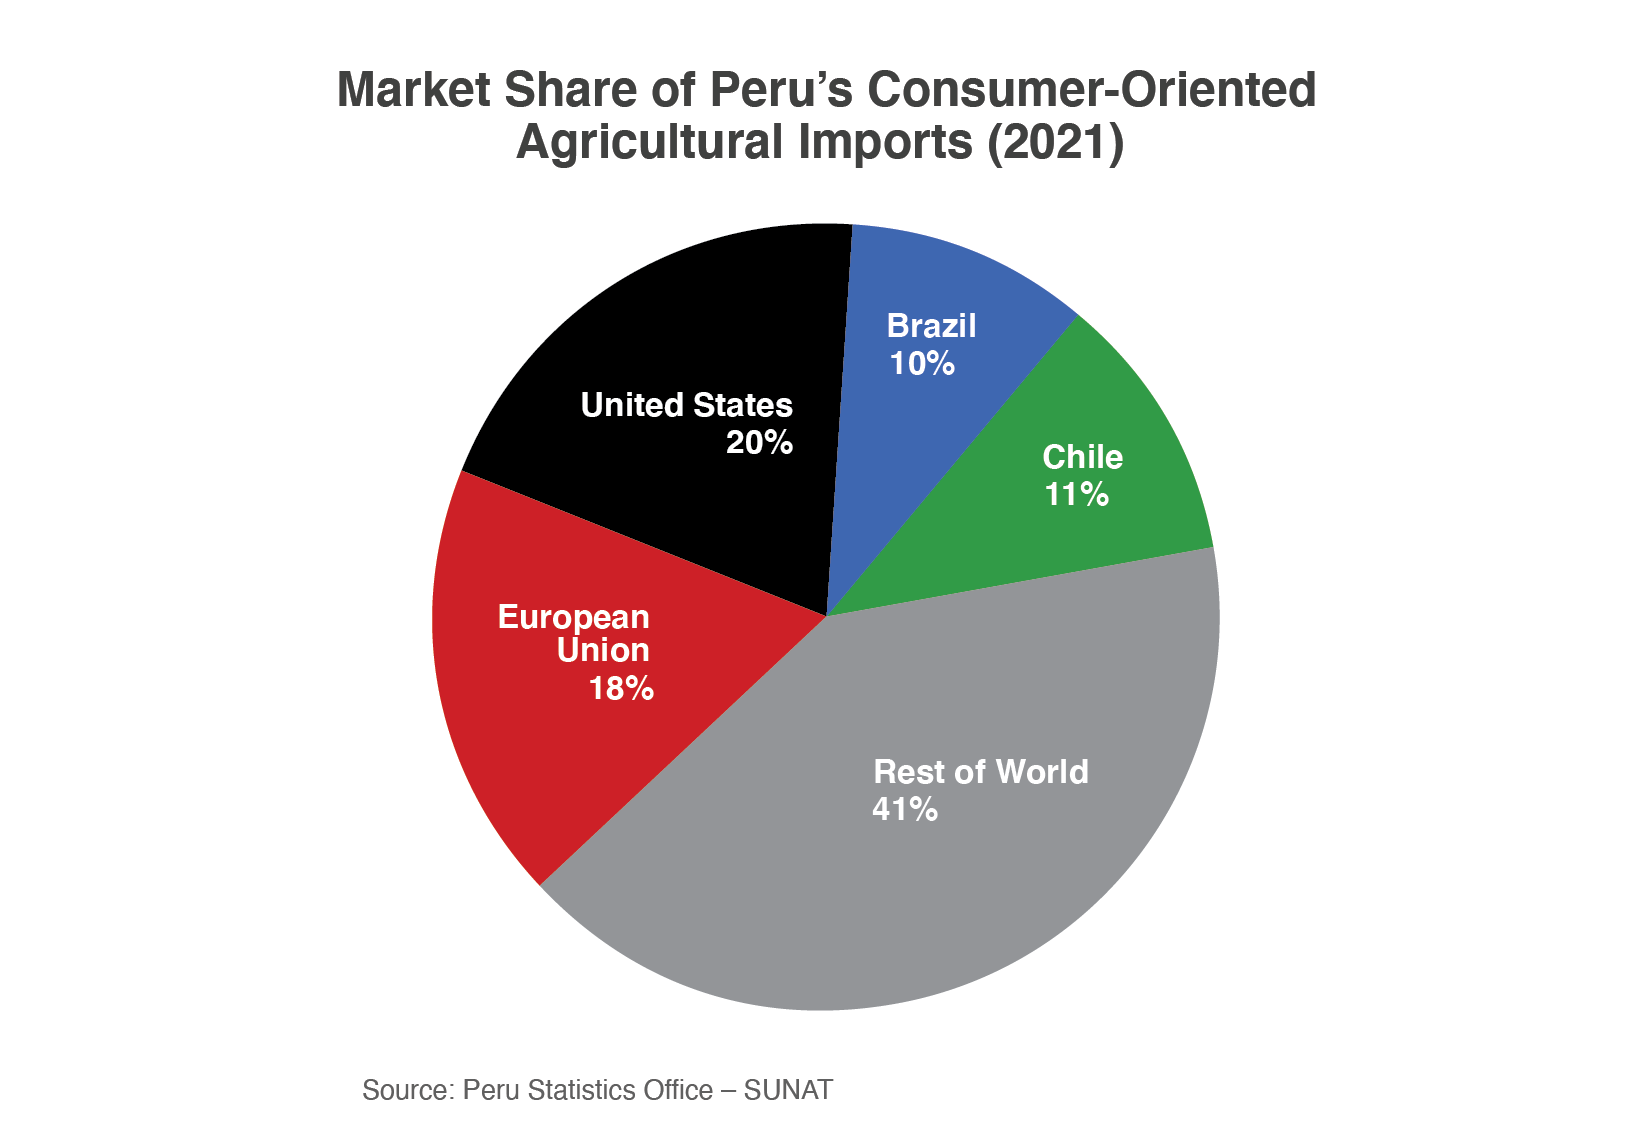
Peru is the third-largest South American market for U.S. consumer-oriented agricultural products. Increasing wealth and lower barriers to entry were facilitated by the implementation of the U.S.-Peru Trade Promotion Agreement (PTPA), resulting in a 423-percent increase in consumer-oriented exports from $65 million in 2009 to $340 million in 2021. More than two-thirds of U.S. farm exports became duty-free immediately upon the PTPA’s entrance into force in 2009, with remaining tariffs to be eliminated by 2026. U.S. dairy, meats, pet food, and food preparations have performed particularly well in the Peruvian market and are primarily distributed through modern supermarket chains.
Macroeconomic Perspective
Peru averaged 4.5 percent economic growth between 2010 and 2019, accompanied by a significant reduction in poverty. Following pandemic-induced contraction in 2020, Peru’s economy grew more than 13 percent in 2021 as vaccination rates improved and consumer demand rebounded. According to Peru’s National Statistics Institute, 45 percent of Peru’s 32 million people are now considered middle class.
A confluence of international and domestic challenges hampered Peru’s economy in 2022. High prices for raw materials and transport raised the cost of food, feed, and beverage imports. The value of Peru’s currency, the sol, is down 6 percent against the U.S. dollar in the last 2 years, further exacerbating high prices for imported goods. Peru is also mired in political turmoil, with its president recently removed and arrested for attempting to dissolve Congress and rewrite the republic’s constitution.
Despite these challenges, Peru’s economy grew 2.7 percent last year and the International Monetary Fund projects yearly growth will average 3 percent through 2027. Future economic expansion will add new entrants to the middle class and provide additional opportunities for U.S. consumer-oriented products to thrive in the Peruvian market.
Consumption Trends and Market Drivers
According to USDA GAIN reports, Peru’s food retail sector was projected to grow 5.3 percent in 2022 and eclipse $26 billion in sales, driven by the proliferation of modern supermarkets and hypermarkets, particularly around the capital of Lima. While traditional street vendors source products locally, modern retail outlets import and sell consumer-oriented products from the United States. There are currently an estimated 320 supermarkets and 1,000 convenience stores in Peru. During the pandemic, the influence of large commercial retailers expanded due to enhanced COVID-19 safety measures and e-commerce options.
Despite the development of the modern sector, traditional wet markets and bodegas still account for more than 75 percent of retail market share. There is a preference among some Peruvian consumers for fresh products instead of frozen products. Domestic producers are also competitive because of low prices, knowledge of preferences, and lack of brand awareness by consumers.
Prospects for U.S. Agricultural Exports
Dairy products
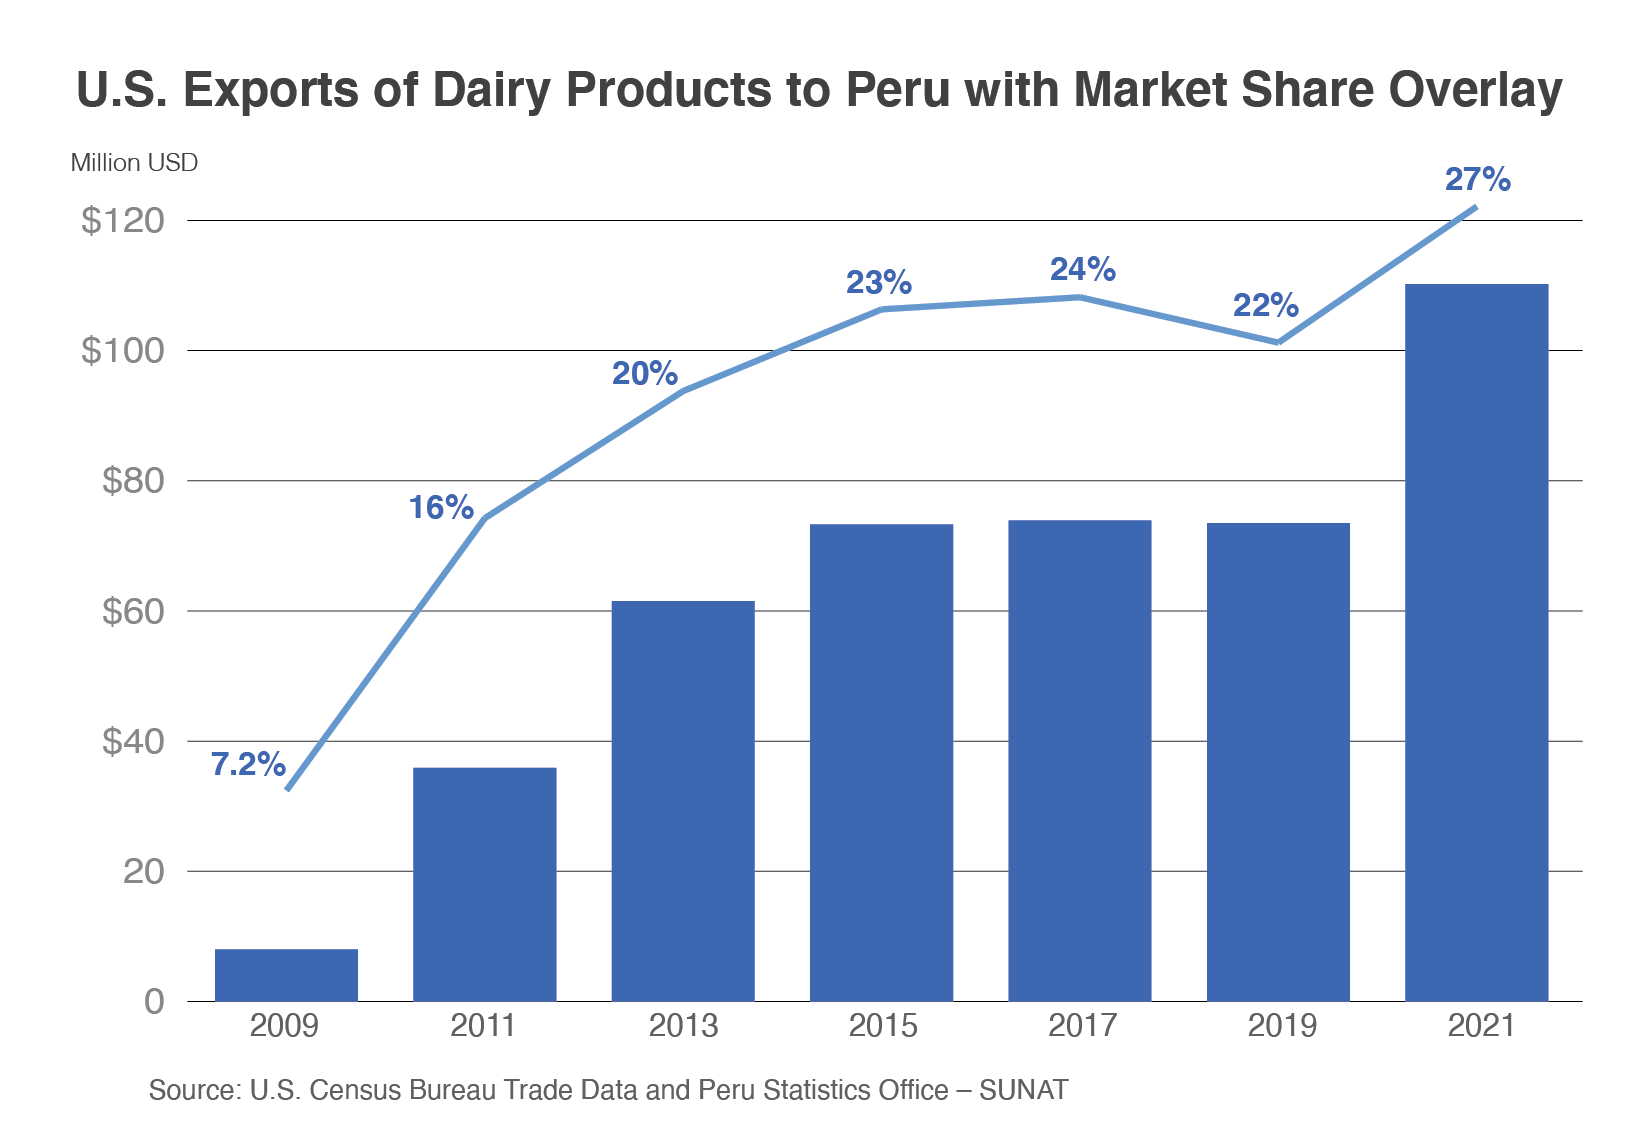
The United States exported $110 million of dairy products to Peru in 2021, more than 13 times greater than in 2009, and holding 27 percent of Peru’s total import market. Powdered milk accounts for 76 percent of exports and has shown significant growth since PTPA implementation, increasing from $2.5 million in 2009 to $84 million in 2021. Powdered milk from the United States enables Peru to fulfill consumer demand, which is 27 percent greater than domestic milk production.1 In April 2022, at the behest of producers, Peru modified its dairy regulation to prohibit the usage of powdered milk for the manufacture of evaporated milk. However, Peru’s processing industry will adapt through changes in product labeling and U.S. exports will not be impacted.
U.S. exports of fresh, grated, and processed cheeses increased 419 percent from 2009 to 2021. The United States has the largest market share of cheese at 29 percent, with strong local preference for edam, mozzarella, cheddar, and parmesan cheeses. U.S. products are used in the food processing sector but also have growth potential in high-end restaurants and hotels.
Poultry and Beef
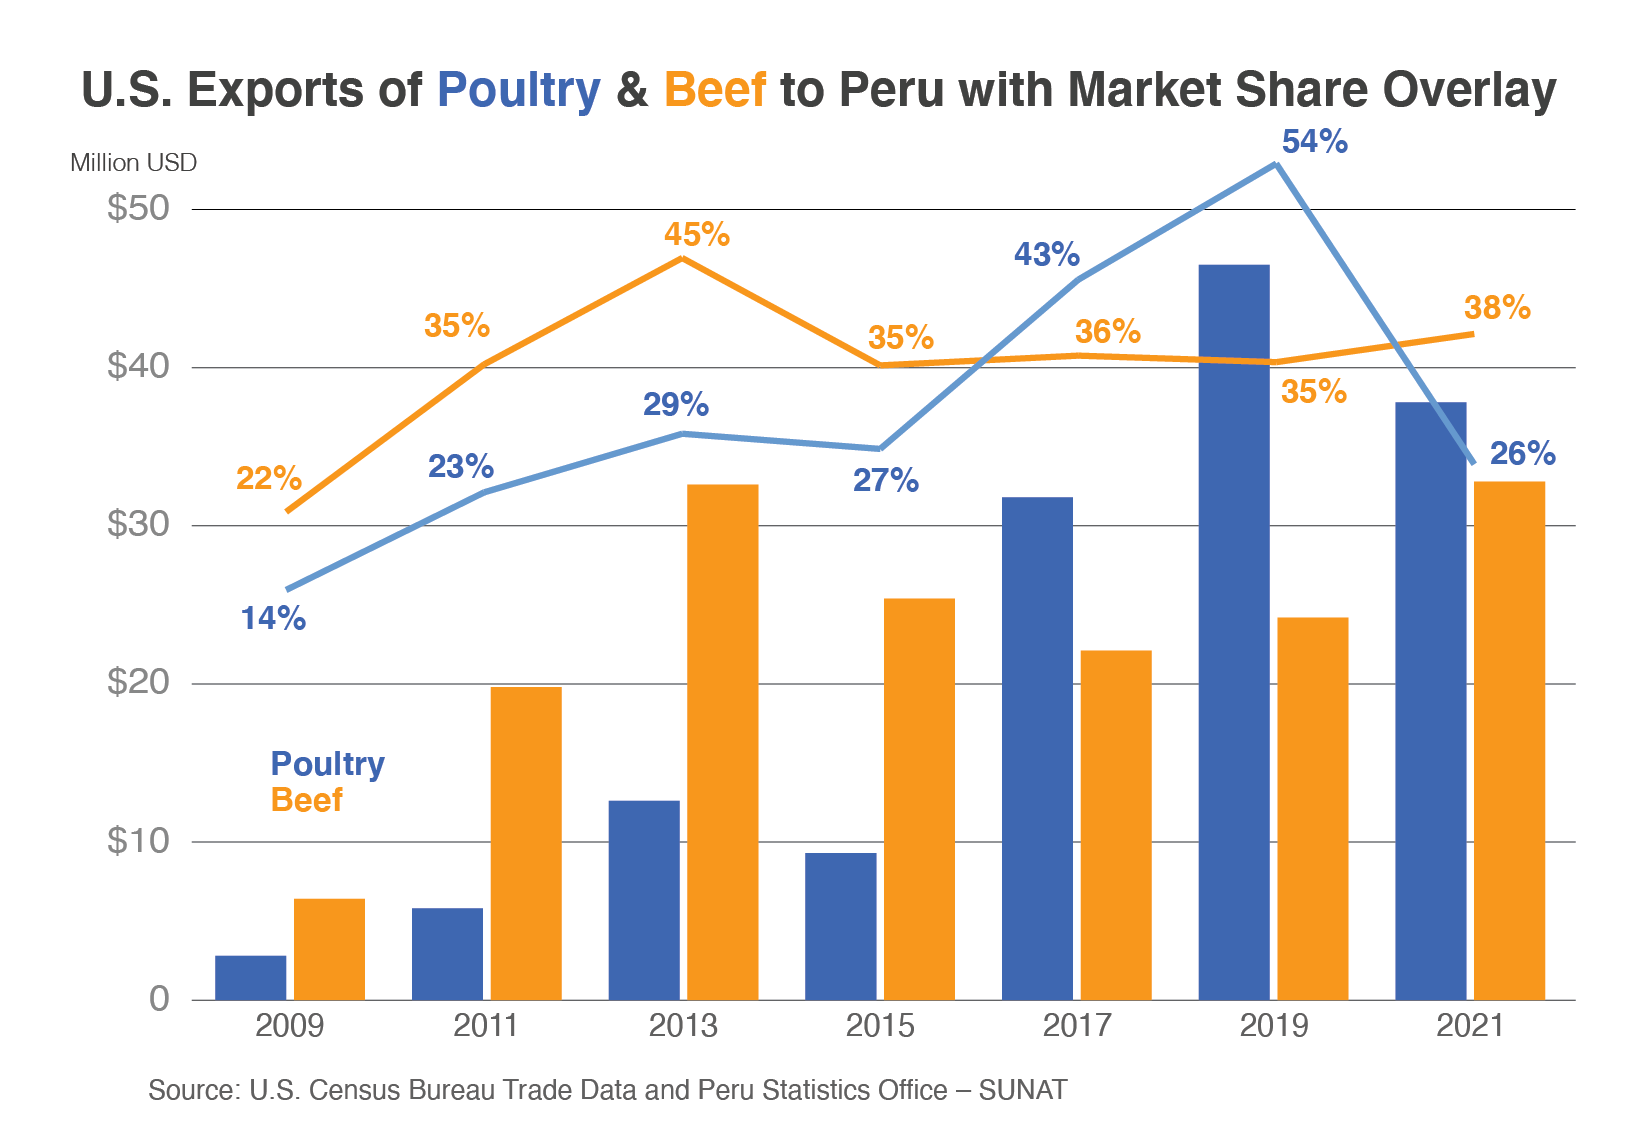
U.S. poultry exports to Peru have risen more than thirteenfold since the implementation of the PTPA from $2.8 million in 2009 to $38 million in 2021. Frozen chicken leg quarters (74 percent) and turkey legs (15 percent) account for most exports, with both categories primarily distributed through the hotel, restaurant, and institutional (HRI) sector. Recently, poultry demand has also increased in the food retail sector. Poultry trade rebounded 63 percent in 2021 after a pandemic-related slowdown in 2020, but higher prices, a strong dollar, highly pathogenic avian influenza restrictions, and competition from Brazil through the first half of 2022 have once again reduced sales.
Beef exports have also increased significantly after implementation of the PTPA, rising more than 400 percent from $6.4 million in 2009 to $33 million in 2021. The United States has the largest market share at 38 percent, followed by Brazil at 25 percent, and Argentina at 13 percent. High-quality U.S. beef is sold in the HRI sector, but there is also a nascent market for affordable bovine cuts for at-home preparation. Promotional activity by the U.S. Department of Agriculture’s Foreign Agricultural Service Lima, such as consumer education at modern supermarkets and traditional wet markets, resulted in a 140-percent increase in bovine liver exports to Peru from $3.6 million in 2019 to $8.6 million in 2021.
Dog and Cat Food
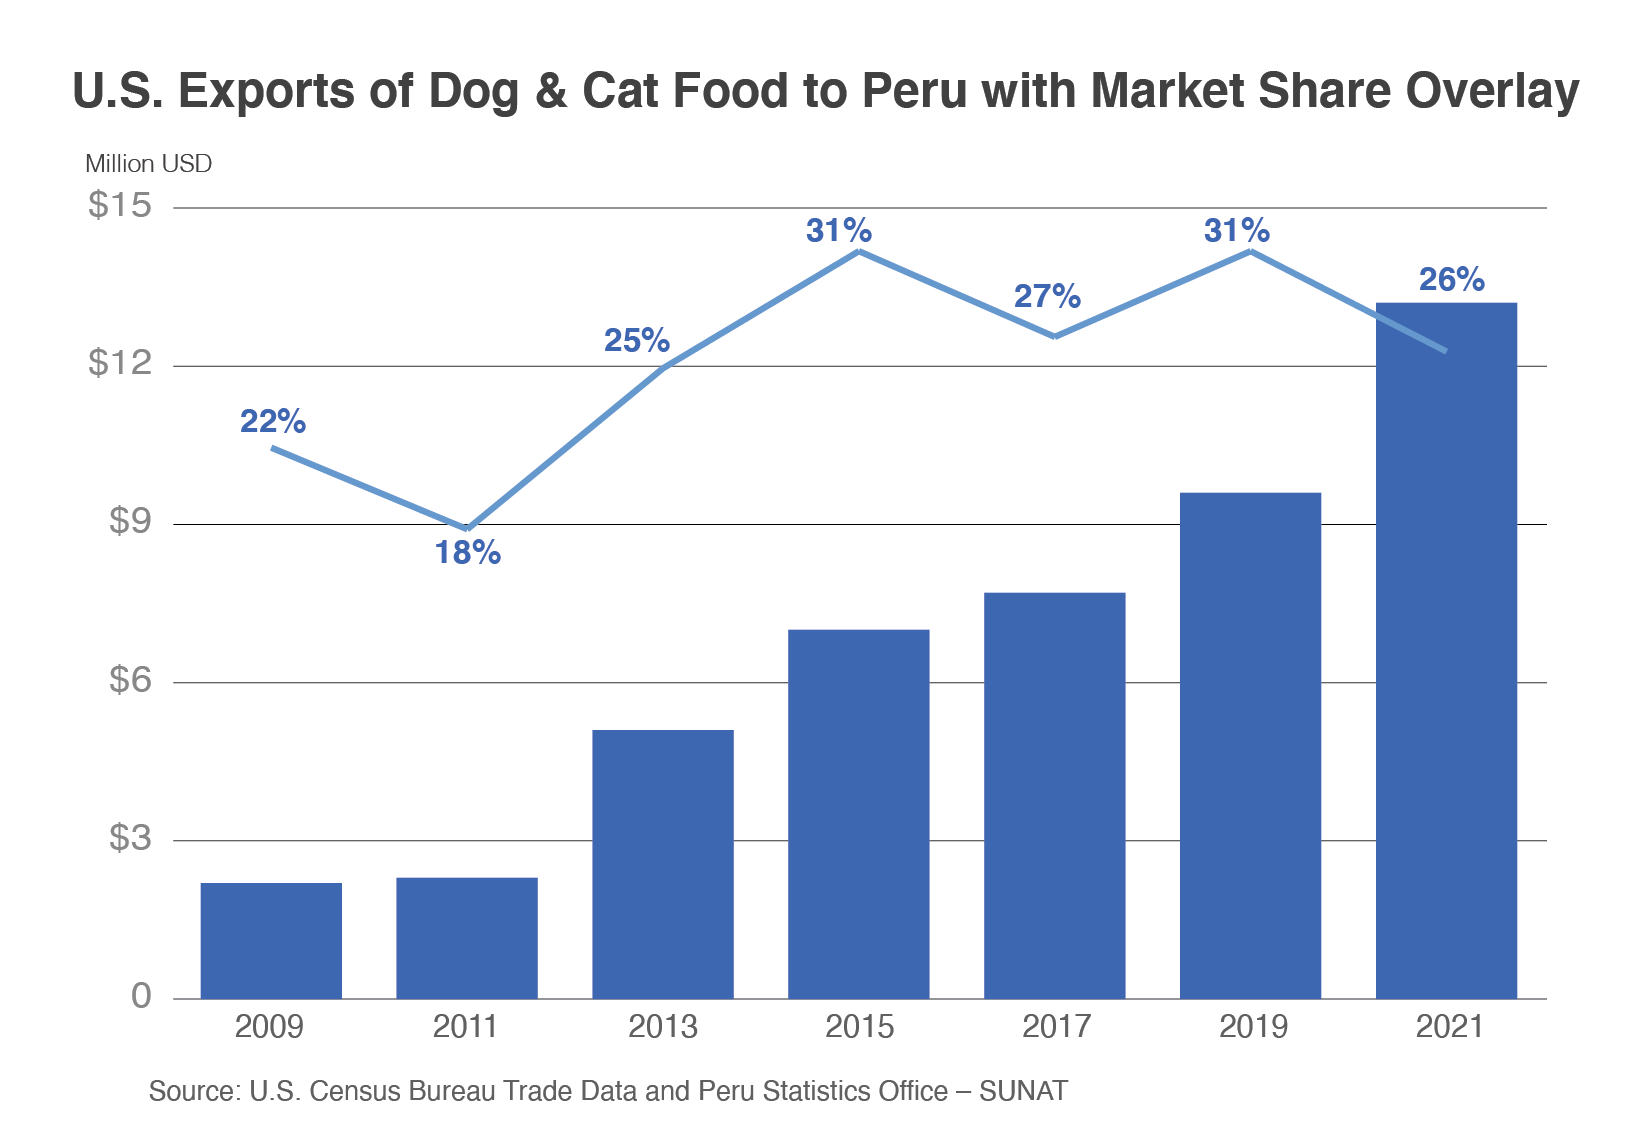
U.S. exports of dog and cat food increased sixfold from $2.2 million in 2009 to $13 million in 2021. According to Euromonitor International, pet ownership is on the rise in Peru, where more than half of households care for a dog and more than a third care for a cat. The number of dogs increased almost 20 percent in the last 5 years alone.
Peruvians are beginning to perceive canine and feline companions as extensions of their human families and have transitioned away from scraps to dry food and affordable premium feed offerings. Wet food is the fastest growing category for dog and cat food. Last year, retail sales of dog food in Peru increased 11 percent and sales of cat food increased 9 percent, with combined sales projected to rise an additional 57 percent in the next 5 years. As a result of better care, animals are living longer and healthier lives. Nascent Peruvian suppliers have sprung up as industry leaders, but there is much room for U.S. product growth, particularly high-quality pet food marketed to supermarkets and hypermarkets.
Food Preparations
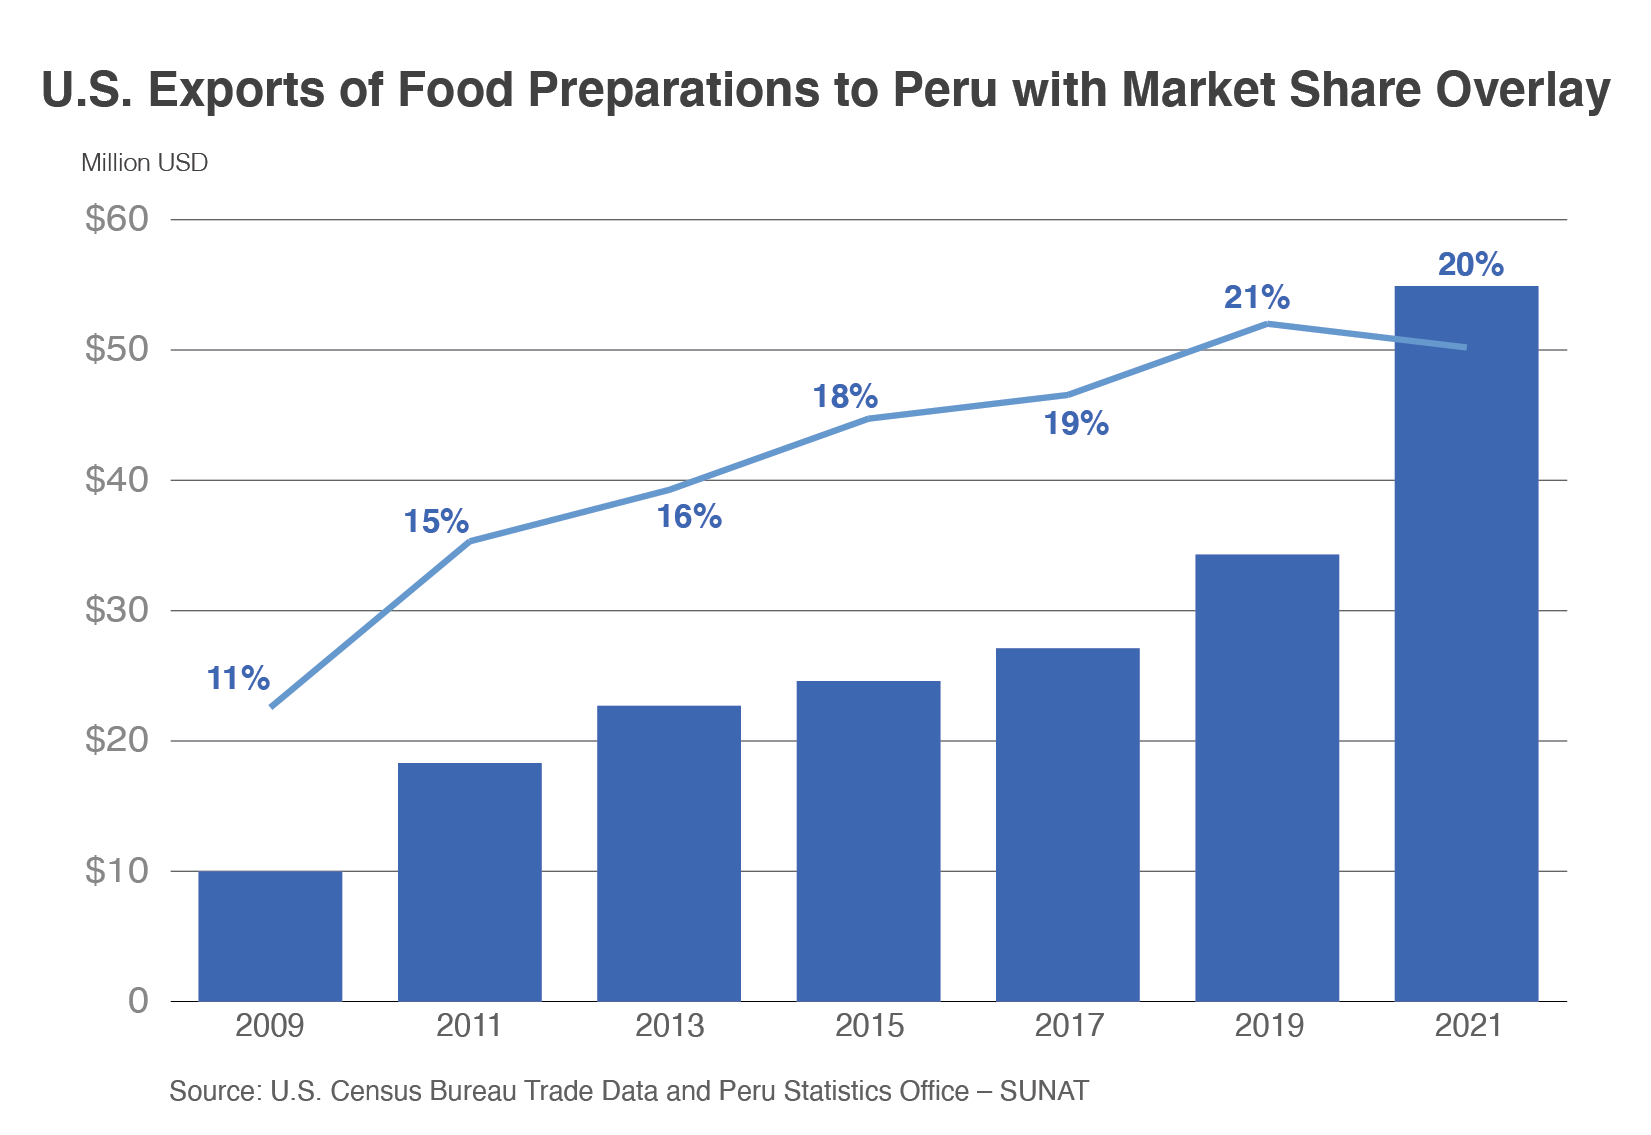
U.S. exports of food preparations to Peru have increased 450 percent from $10 million in 2009 to $55 million in 2021. The United States accounts for 20 percent of food preparation imports, behind only the European Union (EU) with 26 percent. Food preparation exports to Peru are comprised of hydrolyzed protein, food supplements, soy-based snacks, and confectionery. There is a dearth of Peruvian ingredients for production, which is ameliorated by U.S. shipments of food preparations for such items as baked goods and condiments.
Other Consumer-Oriented Products
Since implementation of the PTPA in 2009, U.S. exports of tree nuts to Peru have risen nearly 1,700 percent, eclipsing $9.2 million in 2021. Fresh or dried almonds account for more than half of total value. Peruvian importers have a strong preference for the quality and pricing of U.S. nuts instead of competitors for retail sale and as ingredients in confectionery. Nuts are also gaining popularity among health-conscious consumers as natural alternatives to processed snacks. As a result, sales are projected to increase 44 percent in the next 5 years.2 The United States has the largest market share of tree nuts at 35 percent, ahead of both Brazil (31 percent) and Chile (18 percent).
U.S. exports of baked goods (such as savory snacks, cakes, cereals, and pasta) nearly doubled since PTPA implementation to $8.1 million in 2021. U.S. corn chips represent more than half of the baked goods total and rose 47 percent last year, buoyed by strong demand from the return of leisure activities and in-person schooling after the pandemic. Sales of cereals also increased in 2021 as middle-income consumers increasingly adopt this convenient, on-the-go option as their breakfast food. Gluten-free and healthy snack alternatives have increased in popularity across all product categories.
Alcoholic beverages represent additional growth potential in Peru. Beer is Peru’s drink of choice with a market share of 90 percent among alcoholic beverages. Consumers have shown interest in craft and imported beers with total sales projected to grow at a compound annual rate of 4 percent through 2026.3 U.S. whiskeys are also sought after by bartenders, particularly in hotels and high-end restaurants.
Trade Policy
In the last two decades, Peru has concluded bilateral and multilateral free trade agreements with more than 50 countries covering 3 billion consumers, including the United States, China, EU, Japan, and the Southern Common Market. In sum, Peru’s free trade partners comprise more than 75 percent of global gross domestic product.
Peru’s government is gradually reducing trans-fat allowance in processed foods and is pulling products from shelves for exceeding the currently adjudicated limit (2 grams of trans-fat per 100 grams of product). Hydrogenated trans-fat is fully banned. As of 2019, front-of-package warning stickers are required for food and beverage products that exceed designated thresholds for sugar, sodium, and saturated fat, with a proposed update for 2023 to strengthen reporting requirements. Peru also amended its Labeling Act in 2021 to require country of origin designations for packaged foods and primary processing goods. Though ostensibly designed to encourage domestic purchasing, this labeling could be beneficial for some U.S. products known in Peru for their high quality.
Peru’s sanitary registration process can be lengthy, and exporters should review Peru’s food laws, as well as consider establishing a distribution agreement with a retailer. To clear Peruvian customs, processed food products must be accompanied by a unique customs declaration, a commercial invoice, an airway bill or bill of lading, a packing list, an insurance letter, and a General Directorate of Environmental Health food sanitary registration. Recently, Peru extended a moratorium on the cultivation of genetically engineered organisms for an additional 15 years, potentially impacting the imports of seeds from the United States.
Conclusion
Despite recent turmoil, Peru remains a promising market for U.S. exports of consumer-oriented products. Free trade and growing consumer demand present opportunities for the expansion of products into Peruvian supermarkets and hypermarkets. Promotion activities to increase awareness among Peruvian consumers and importers about the variety and quality of U.S. products are likely to further improve prospects for exporters in the future.
1 USDA Production, Supply, and Distribution (PSD) data
2 Euromonitor Passport
3 Euromonitor
