India Agricultural Trade: Expanding Export Opportunities Amid Persistent Limitations
Contact:
Link to report:
Printer-Friendly PDF (380.42 KB)
India offers promising export growth prospects for U.S. agriculture with a large and rapidly expanding middle class, rising disposable incomes and shifting consumption patterns toward higher-value agricultural commodities. India’s imports of U.S. agriculture have been growing, particularly consumer-oriented agricultural goods, where products have made major headway. However, political, cultural and policy factors have limited U.S. exports from reaching their full potential. Despite these constraints, agricultural imports will continue to rise as India’s demand exceeds supply for certain food and agriculture products.
India is a promising export market for U.S. agricultural goods.
Nearly everything in India is flourishing, from its economy and middle class to its increasingly young population and growing demand for consumer-oriented agricultural products. According to the latest reports:
- India’s economy will double between 2010 and 2020, and is projected to nearly double again between 2020 and 2030.i
- Between 2015 and 2020, India’s middle class will double in size and overall consumption will quadruple.
- Disposable income will almost double between 2015 and 2025, and total consumer expenditure on food will also grow.ii
- In ten years, India will have the world’s youngest population. With 1.3 billion people and a significant population growth rate, India is expected to add 148 million people by 2026, an increase larger than the current population of Japan or Mexico, at which time it will surpass China as the world’s most populous country.iii
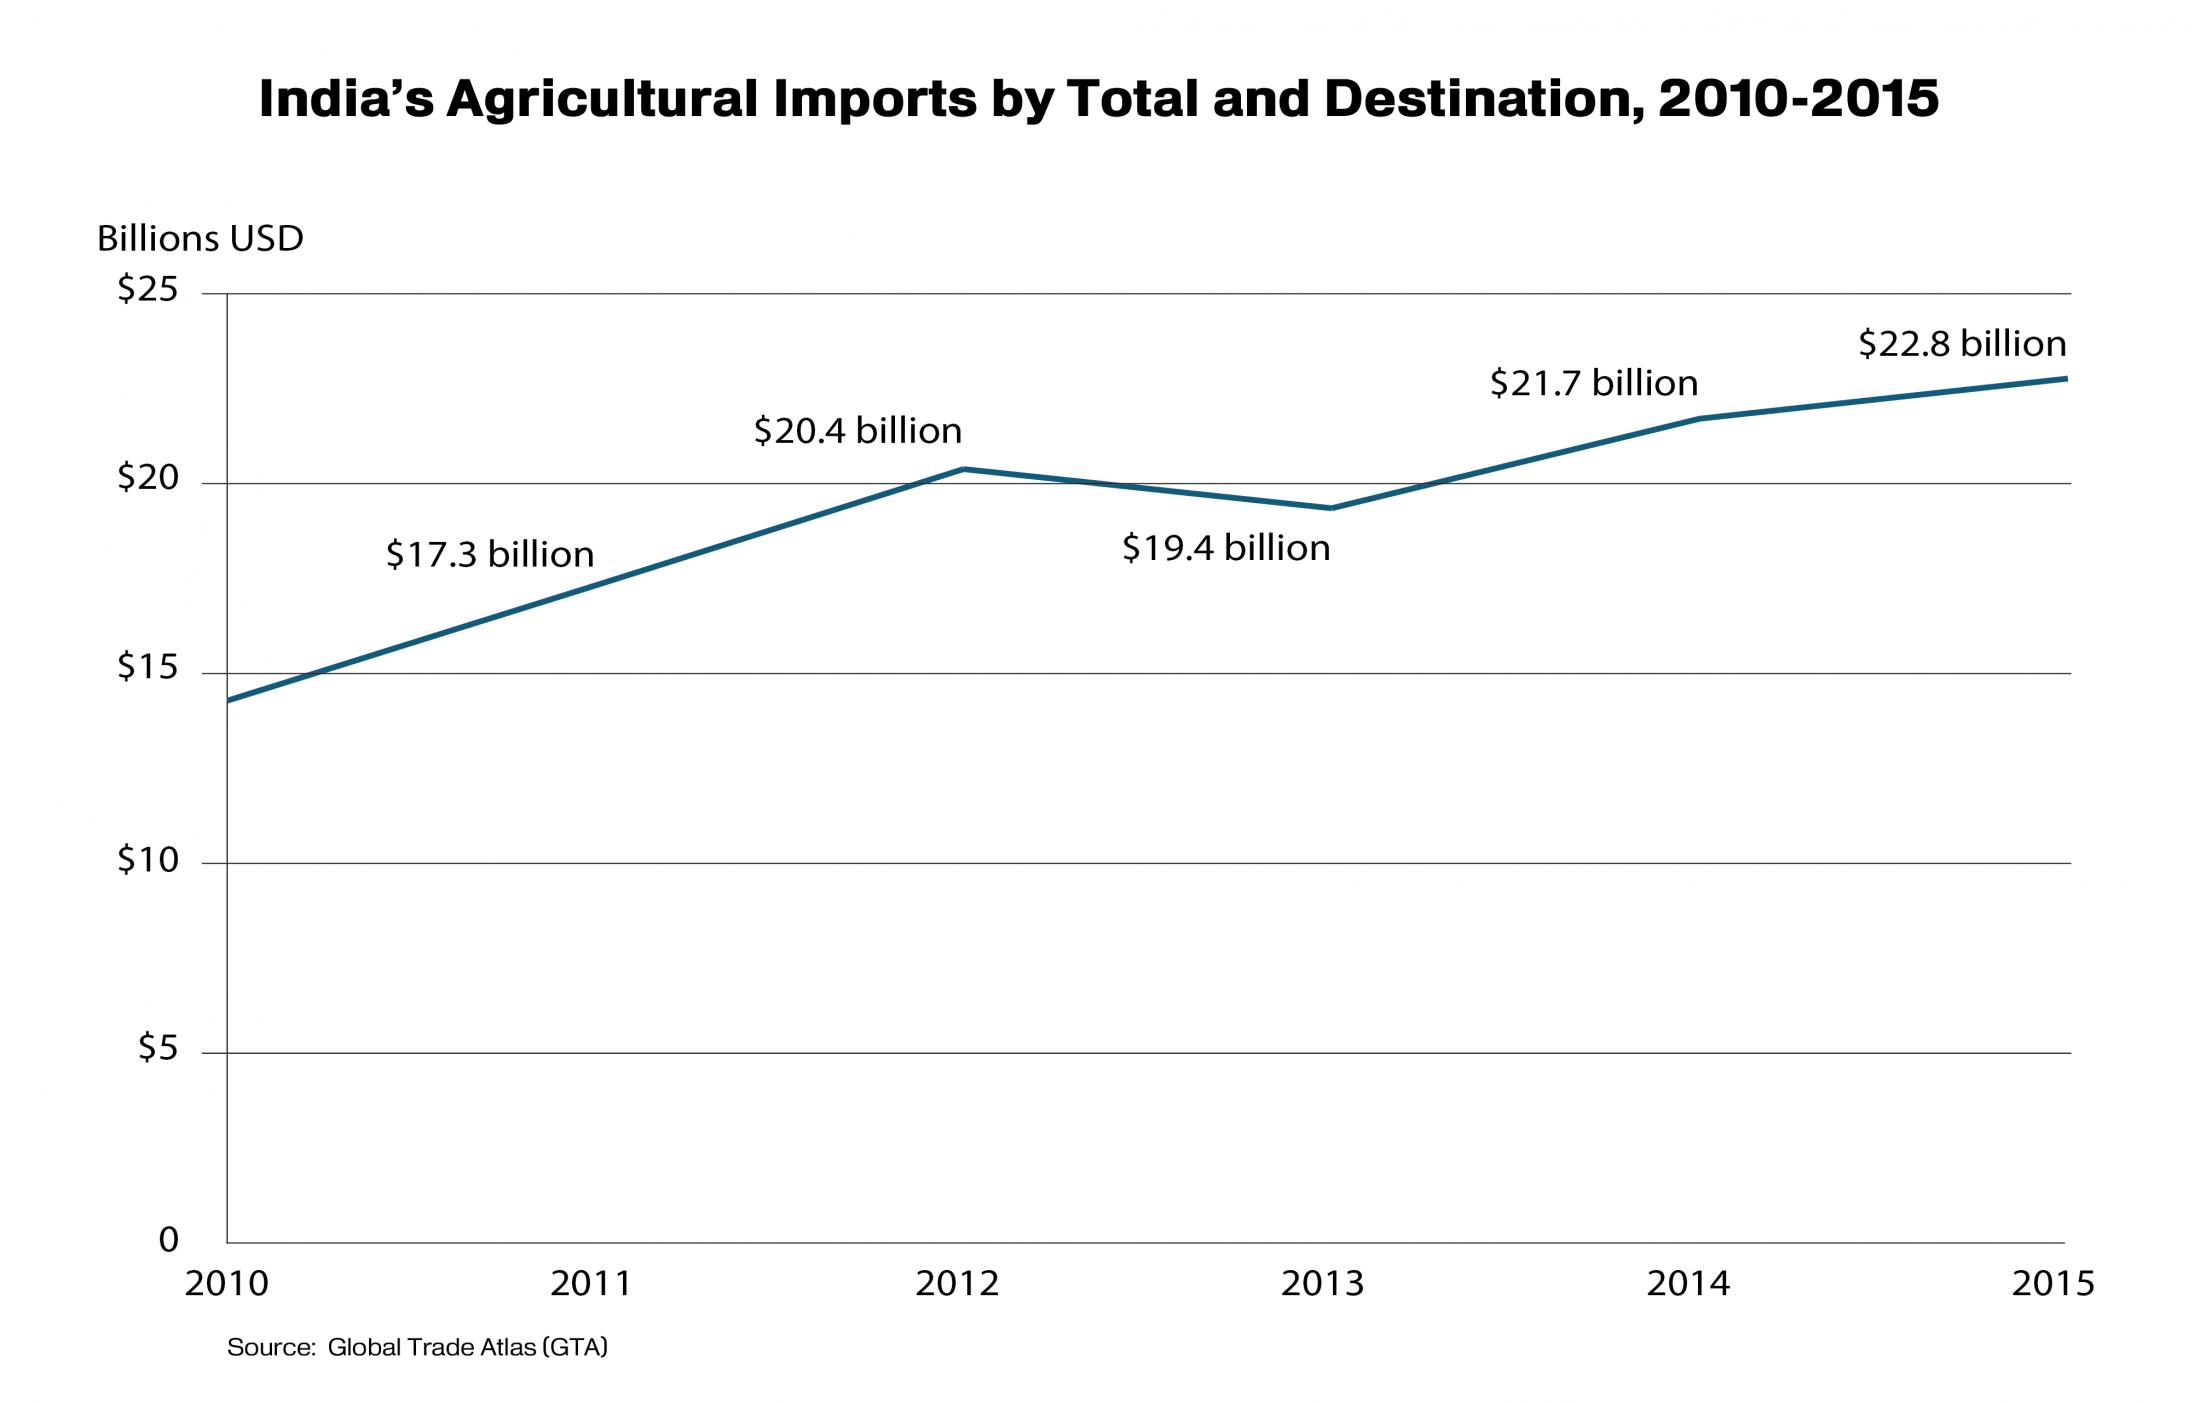
To feed its richer, younger and more urban population, India’s annual agricultural imports continue to rise and are expected to continue to grow in the future. Since 2010, India’s annual agricultural imports increased more than 60 percent, from $14.1 billion to $22.8 billion in 2015. Imports of bulk and intermediate goods, like pulses and edible oils, more than quadrupled over the past ten years. In addition, India’s imports of consumer-oriented agricultural products, the fastest-growing import category in recent years, doubled since 2010, as India’s consumers increasingly demand high-value foods.


India’s import potential is not yet fully realized, as significant inefficiencies constrain growth.
Despite promising economic indicators, agricultural trade is constrained by continued significant government intervention in the agricultural sector. The agriculture sector is key to India’s economy. As a source of livelihood, agriculture remains the largest sector of the Indian economy; agriculture contributed $339.7 billion to gross domestic product (GDP) in 2015, representing 17 percent of total GDP. Agriculture supports over half of total employment and accounted for 11 percent of total exports in 2015. Progress in agriculture affects the lives of the largest group of low-income individuals in the country, making agriculture sensitive, complex and highly politicized in India.
Government policy focuses on ensuring self-sufficiency in staple commodities on the supply side, thereby targeting India’s large rural and voting population, and subsidizes low food prices for a massive number of people in urban and rural areas who qualify as low-income. India’s National Food Security Act of 2013 subsidizes the purchase price of rice, wheat and coarse grains for approximately two-thirds of India’s population, which largely dictates India’s production mix. Rising food prices are an enduring political issue, as food demand has risen faster than supply, and India has enacted a number of unsuccessful measures to lower prices of commodities such as wheat, rice, pulses and sugar.
Input subsidies and minimum price supports for producers are key domestic policy tools to support agriculture and encourage domestic production for food self-sufficiency. The forecast total federal farm subsidy and domestic support bill for 2016/17 is estimated at about $51.2 billion, which includes the cost of price supports, storage and public food distribution, fertilizer subsidies and other subsidies.iv Despite India’s ongoing policy since the 1960s to manage the food supply, almost half of the grain managed by the public distribution system in 2011/12 did not reach intended beneficiaries.v
In the quest for self-sufficiency for many basic food commodities, India’s trade policy has focused on export controls and a highly restrictive import regime. Other market-distorting government policies and trade barriers, including government involvement in aspects of marketing and procurement of agricultural goods, also limit India’s trading potential. High Indian agricultural tariffs impede many U.S. agricultural exports, such as fresh and dried fruits, vegetables, some nuts, and various processed food products and food ingredients. Sanitary and phytosanitary (SPS) measures keep out specific U.S. products, such as poultry, swine, dairy, and most grain and oilseed crops, including genetically engineered (GE) cereal crops. Other non-tariff barriers, including import bans, quality standards, and labeling and packaging rules, further limit India’s ability to import agricultural products from the United States and others. Such protectionist policies keep India’s per capita agricultural imports artificially low.
Despite government intervention to control markets and imports, food security has not been attained. India has the largest number of malnourished people in the world. About 10 percent of the population, or 125.2 million Indians, were food insecure in 2015.vi In 2016, according to the International Food Policy Research Institute’s Global Hunger Index, India ranked 97th out of 118 countries, behind Sri Lanka, Bangladesh and others.vii It was 80th out of 104 countries the previous year.viii Despite income growth over the last decade, India remains one of the world’s poorest countries. The UN Development Program Human Development Report 2015 estimates that nearly a quarter of Indians live on less than $1.25 per day.ix In 2015, 69 percent of all households earned less than $5,000 (real 2005 U.S. dollars), and 96 percent of all households earned less than $20,000.x
Production and consumption trends in India suggest imports of undersupplied products are imminent.
India produces enough of many basic commodities for its population, such as rice, wheat, corn, milk and milk products, sugar and most vegetables. India is the world’s largest producer of cotton, pulses, millet, cottonseed, and spices and has the world’s largest cattle herd (cows and buffaloes). India has emerged as a major exporter of rice, cotton and carabeef (buffalo meat) over the last decade, and is expected to remain important in each of these markets.
For some products that India produces, such as poultry and dairy, imports appear imminent as growing demand from its population may exceed production capabilities in a few years. Total per capita meat consumption is low but growing rapidly at 9 percent per capita in 2014,xi mainly driven by rising incomes, socio-economic and demographic changes and urbanization. According to a nationwide government survey, 71 percent of Indians over the age of 15 are non-vegetarian,xii yet access to meat imports is restricted. The export and import of beef is prohibited due to religious sensitivities, while pork, poultry, meat products, dairy and egg imports are historically negligible or zero due to high tariffs and other measures. Poultry meat is the most consumed meat in India followed by carabeef, both currently supplied exclusively by domestic industry. Poultry is relatively lower in price and the most universally accepted meat product, since different ethnic groups have cultural and religious exclusions for eating cow beef, pork and other meats. Though it is a very small segment, the processed meat segment, particularly processed poultry, is growing at a rate of 15 to 20 percent per annum (GAIN). As demand for meat grows and evolves, Indian consumers will demand more production and more choice, thereby pressuring domestic capacity to expand and government-imposed import restrictions to change. Similarly, dairy consumption in India is estimated to grow twice as fast as domestic dairy production. Consumer-oriented dairy demand may eventually go unmet by domestic production, especially given highly dispersed milk production, inadequate cold storage infrastructure, and weak procurement and retail systems. India’s market for fish and seafood is also growing, with 5 percent volume growth in 2015, and forecasted 3 percent growth from 2015 to 2020 to reach 8.8 million metric tons in 2020.xiii Compared to neighboring countries, per capita consumption of fish and seafood is very low, held back by import duties, weak cold storage infrastructure and other constraints.
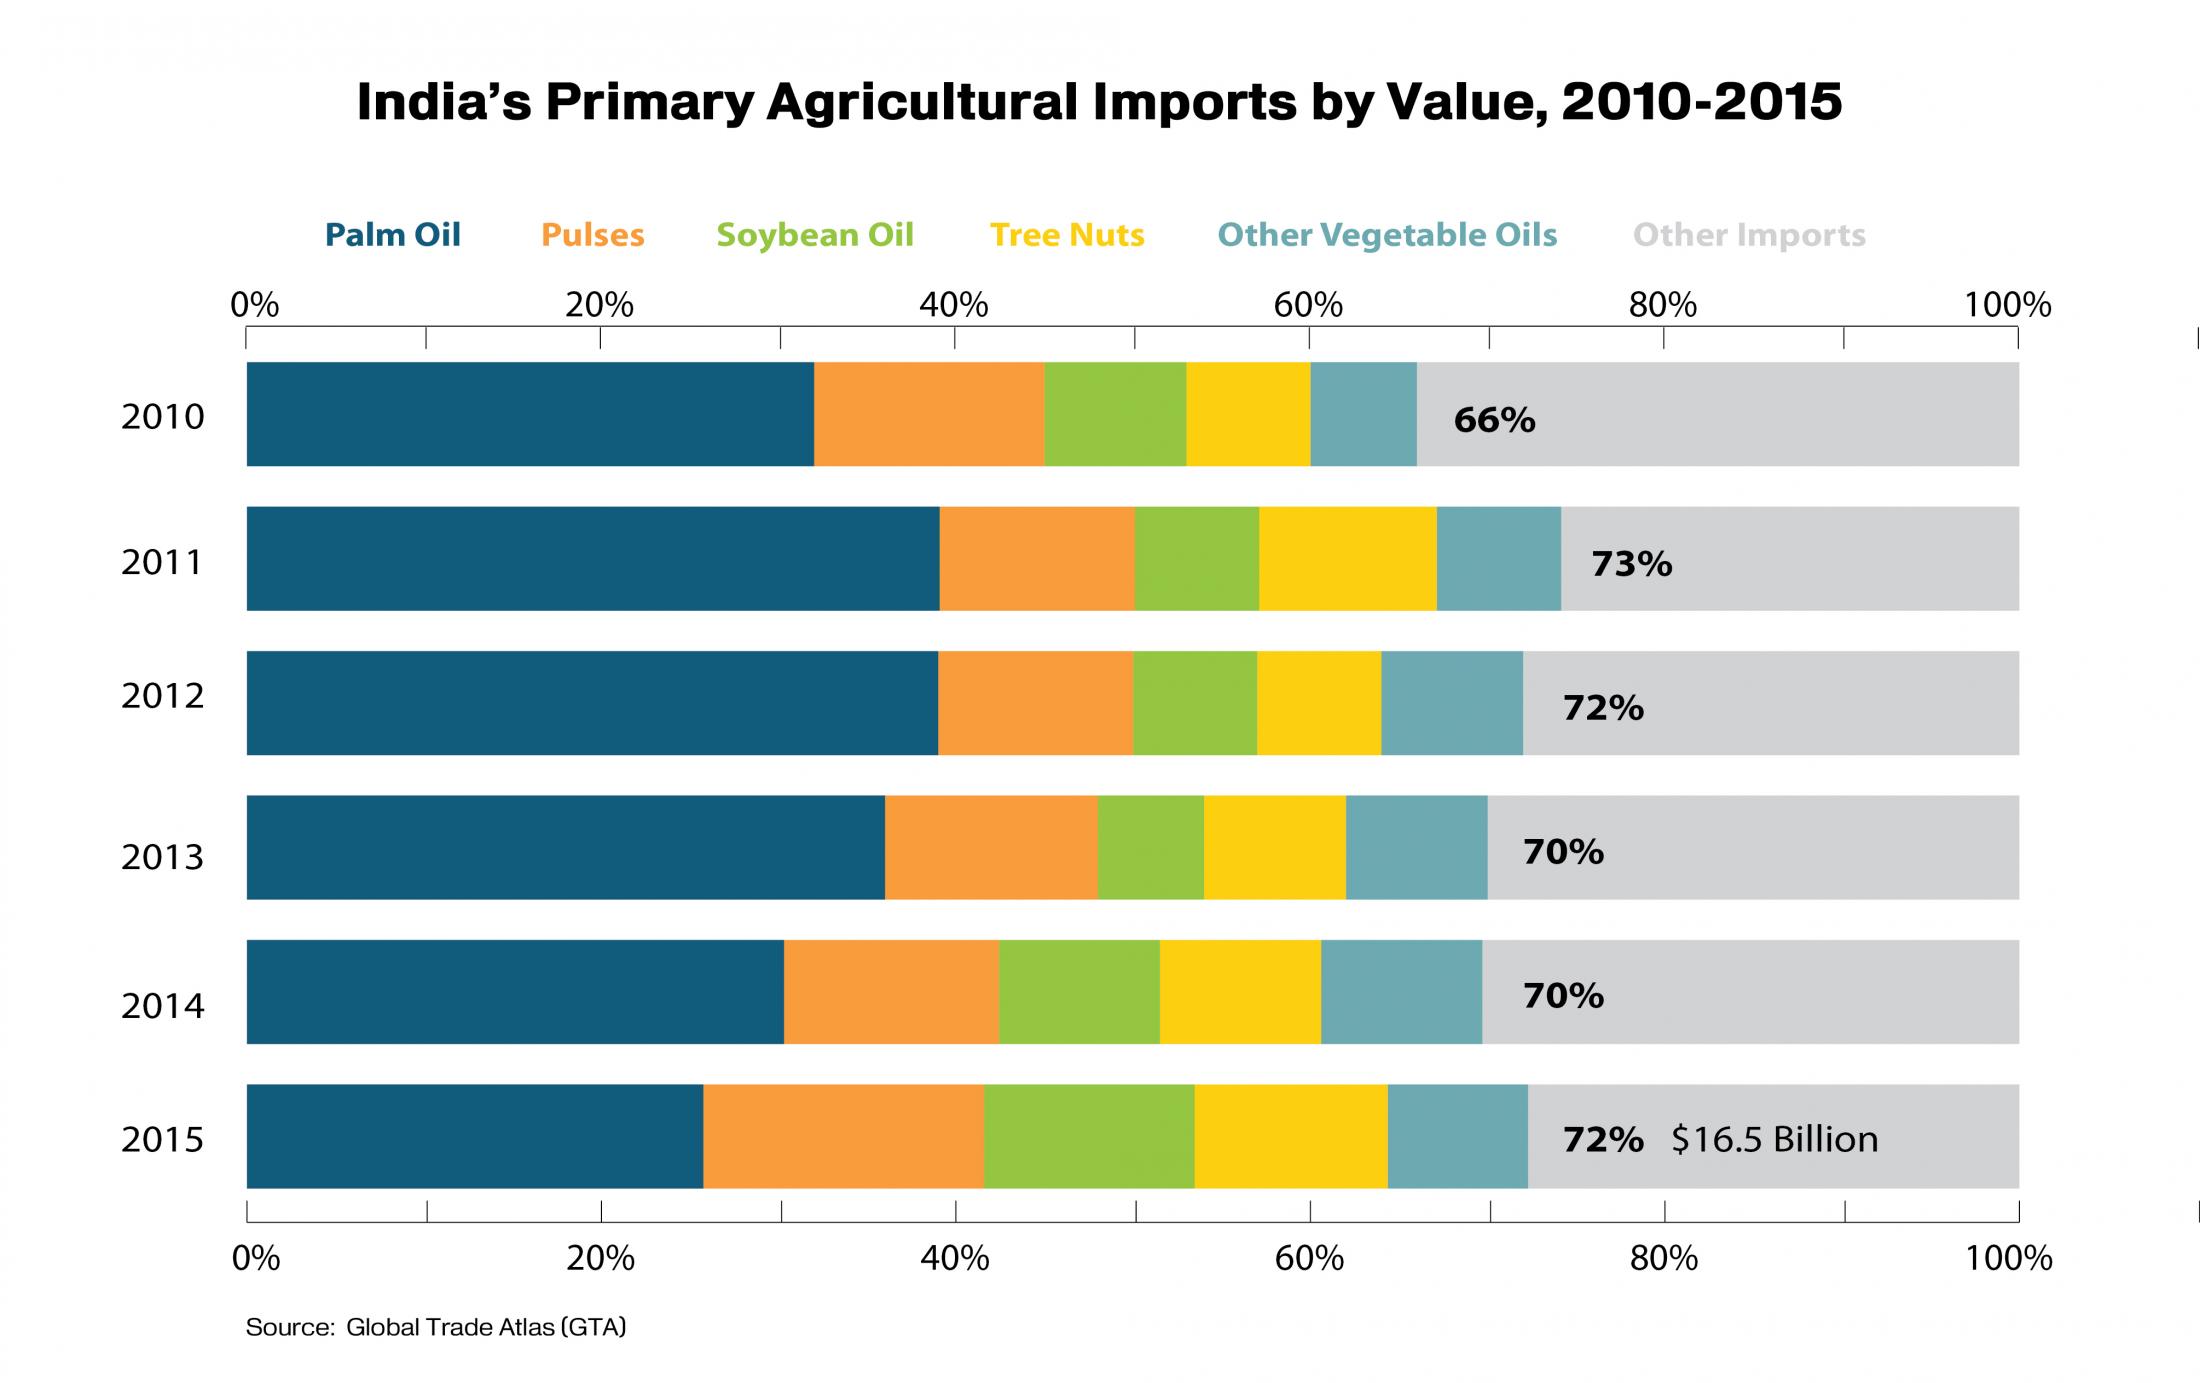
Currently, India’s imports consist primarily of staple foods that are undersupplied by domestic production, such as pulses and vegetable oils. Limited product groups (palm oil, pulses, soybean oil, other vegetable oils and tree nuts) make up 72 percent of India’s total agricultural imports by value, and strong competition from low-cost international suppliers keep U.S. agricultural exports down. Although the United States is competitive in tree nuts and pulses, it is not price-competitive in edible oils. Indonesia, Malaysia, Argentina and Ukraine, all oil suppliers, together capture about 46 percent of India’s total agricultural imports by value. Although low-cost palm oil continues to account for the largest share of India’s edible oil imports, India surpassed China in 2013/14 to become the world’s largest soybean oil importing country. Besides GE soybean oil, no other GE food products, bulk grains, or processed or semi-processed foods are currently authorized for importation.

U.S. Agricultural Exports to India Reach Record Highs
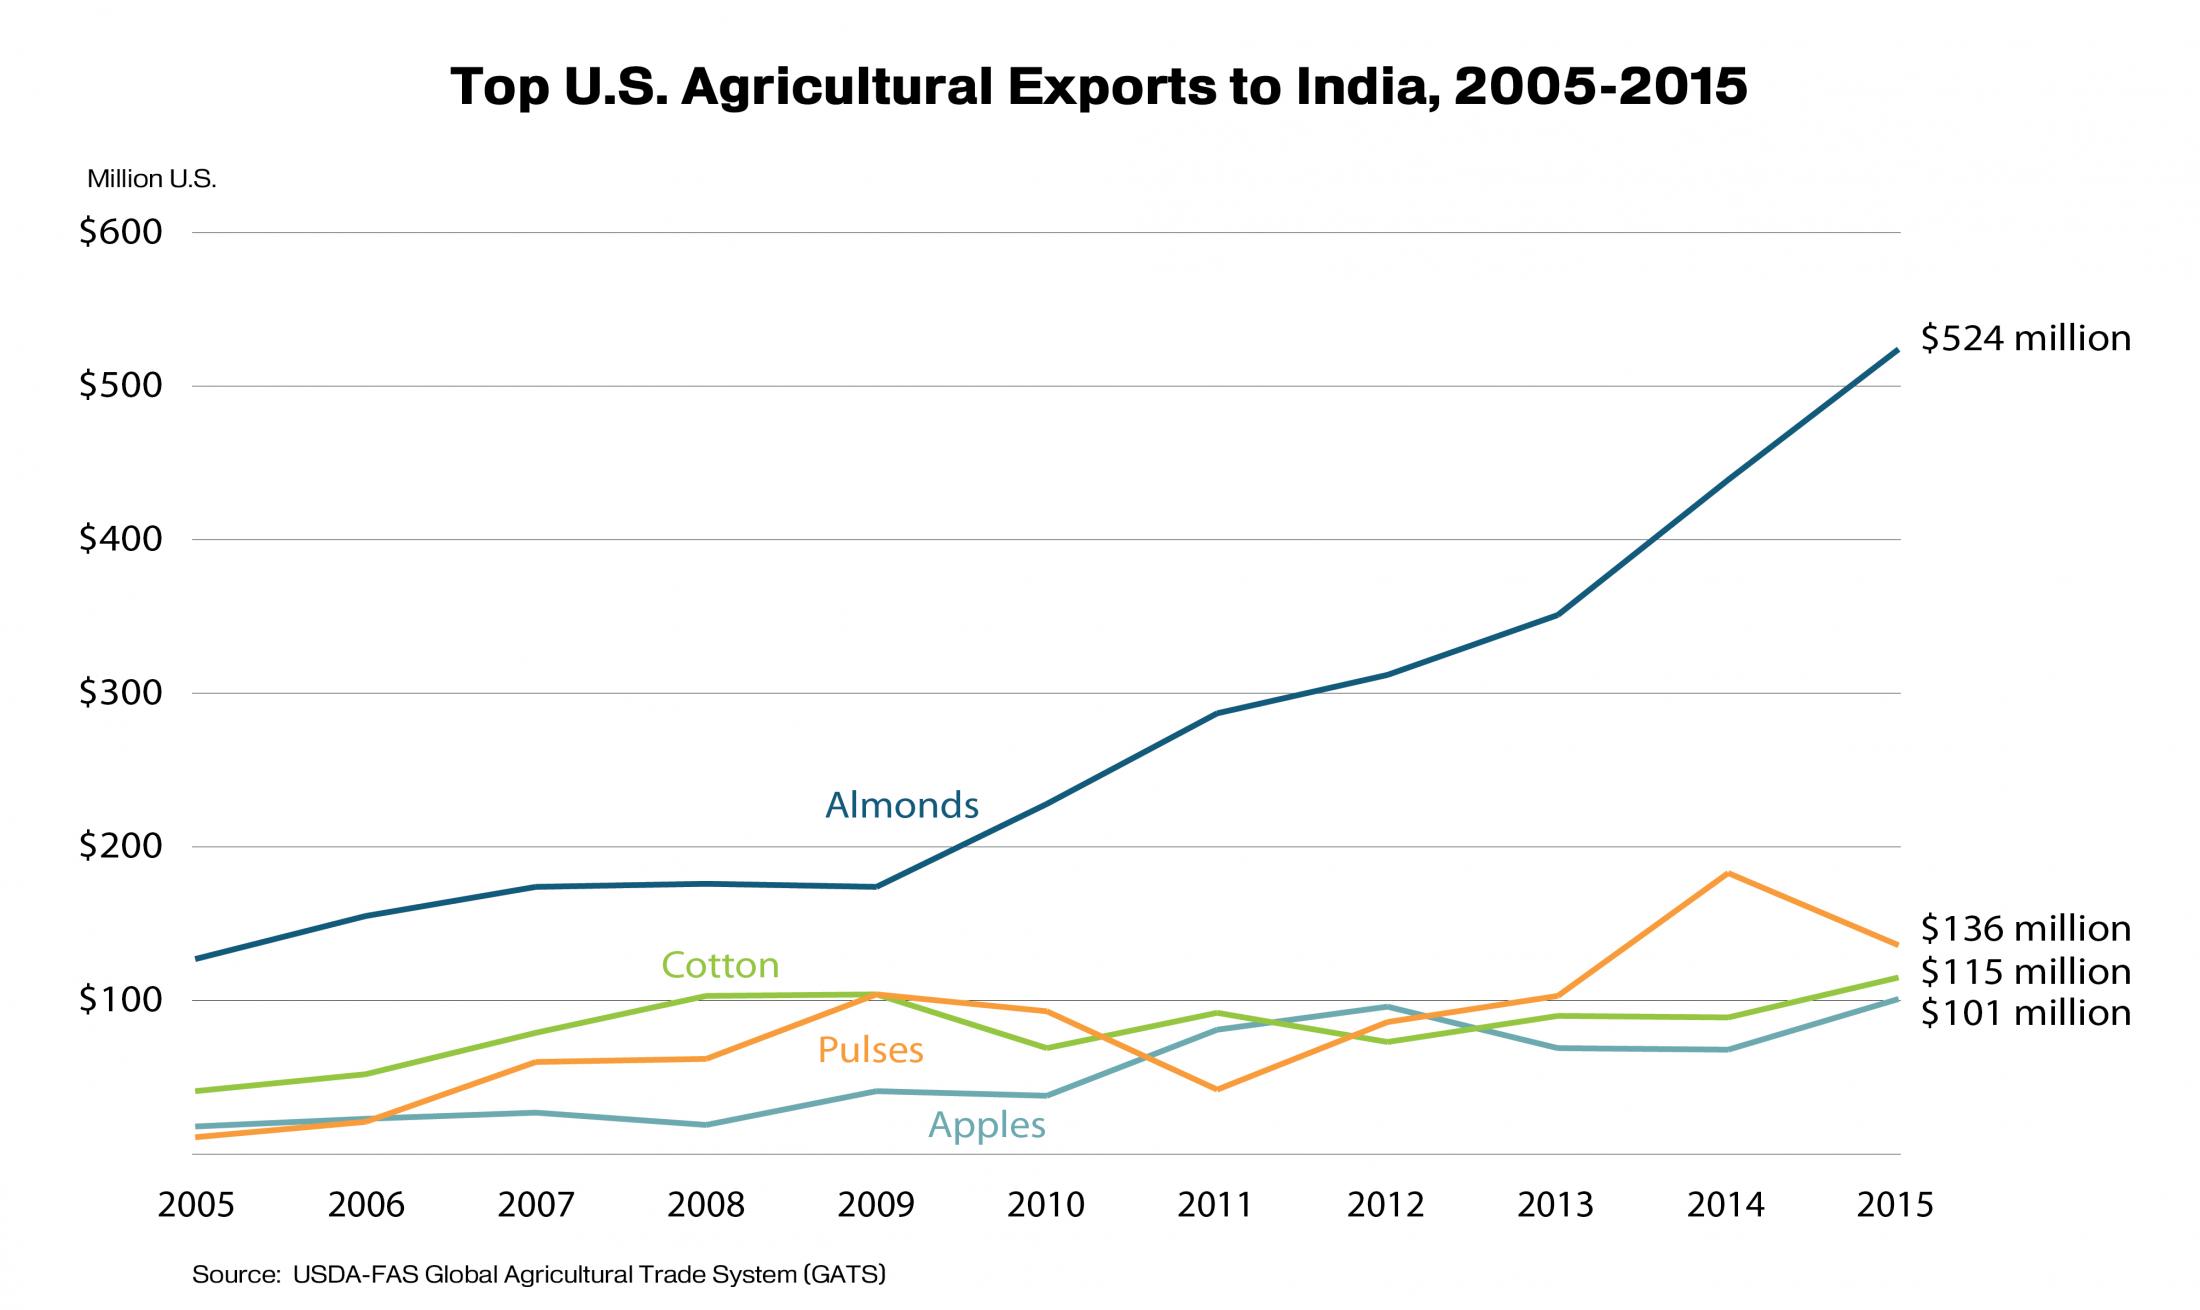
U.S. exports of agricultural and related products to India grew 14 percent since 2014 to a record $1.3 billion in 2015, making India the 20th-largest market for U.S. agricultural, fish and forestry exports by value. And, despite an overall decline in U.S. agricultural exports to nearly every other major region in the world, U.S. exports of agricultural products to India have increased during the first nine months of 2016 relative to the same period last year. Top U.S. agricultural exports to India, by value, are: tree nuts, pulses, cotton and fresh fruit. Together these product groups comprise nearly 75 percent of total U.S. agricultural exports to India in 2015. For these key product groups, exports consistently exceed $50 million and growth in trade has been strong. Animal feed exports to India from the United States are currently small, but could become a significant market.

Tree Nuts: India’s tree nut imports from the world more than tripled from $680 million in 2005 to $2.4 billion in 2015. India is the world’s fourth-largest consumer of almonds and fifth-largest consumer of walnuts. Tree nuts represent half of U.S. agricultural exports to India by value. The United States is the largest supplier of tree nuts to India, with U.S. almond and walnut exports totaling $524 million and $58 million, respectively. In 2015, the United States enjoyed a 73-percent market share for almonds by value. Australia, which produces similar varieties and qualities of almonds as the United States, is the main market competitor with 21-percent market share by value.
Pulses: India is the world’s leading producer, consumer and importer of pulses. Pulse imports reached 5.4 MMT in 2015, and India’s appetite for pulses is growing strong. Peas account for nearly 40 percent of India’s pulse imports, followed by lentils (21 percent), chick peas (13 percent), mung beans (11 percent) and others like pigeon peas. The United States exports primarily peas and lentils to India, valued at $138 million, and representing 10 percent of total U.S. agricultural exports to India. Canada is the leading supplier of lentils to India (also globally) followed by the United States and Australia. Between 2009 and 2015, Canada’s market share by volume varied from 73 to 91 percent, while the U.S. share ranged from 6 to 22 percent depending on the price differential between the two countries. In the years when U.S. prices were competitive, U.S. market share increased. The market share of U.S. pea exports to India has stayed flat at 10 to 12 percent by volume, with Canada's share hovering around 85 percent in recent years. Relative to Canada, U.S. competitiveness is challenged by higher transportation costs and smaller volume of domestic production. Given the fact that most imported lentils are processed in India, Indian importers are price sensitive and do not offer a quality premium. Demand is forecast to grow by 16 MMT to 39 MMT by 2050 due in part to a rising demand for protein, stressing domestic supplies and pushing imports higher.xiv The Indian government is increasingly prioritizing the production of pulses and oilseeds through higher Minimum Support Price (MSP),xv resulting in a 41-percent increase in pulse planting this season (GAIN). Nonetheless, pulse demand is expected to be at 24 MMT and production at 20 MMT,xvi making pulse imports necessary despite the higher expected domestic production.
Cotton: India is the world’s largest cotton producer by volume, the third-largest consumer of cotton by volume, and the sixth-largest importer of cotton by value. India is also the world’s largest producer and consumer of cottonseed meal and cottonseed oil. U.S. cotton exports to India have increased significantly by value and volume since 2000, reaching $115 million in 2015, and accounting for 9 percent of U.S. agricultural exports to India. Cotton imports hit $386 million in 2015, and import demand continues for high-quality cotton from the United States. The United States is the largest of India’s many suppliers with a 21-percent market share by volume.
Apples and Other Fresh Fruit: India’s fresh fruit imports were valued at $589 million in 2015 and increasing annually, with apples and dates representing 70 percent of India’s total fresh fruit imports from the world by value. The United States is the largest fresh fruit exporter to India, with U.S. apple exports representing 90 percent of U.S. fresh fruit exports to India by value. With imports of U.S. apples reaching $115 million in 2015, and total apple imports from the world totaling $215 million, there is an opportunity for increasing U.S. market share, especially if import duties were reduced from 50 percent to more reasonable levels and ongoing SPS-related restrictions were resolved. Grapes trail apple exports considerably at $12.86 million. Fresh U.S. pears have seen exports grow from zero to $3.6 million between 2013 and 2015. However, continued growth is uncertain as China’s market share for fresh pears dominates at 50 percent.
Feed Crops: Historically, for most feed ingredients, India’s large consumption needs have been fulfilled by production. However, India’s growing beef, dairy, poultry, aqua and starch sectors pressure grain supplies and point to a foreseeable shortage in feed grains that may in turn drive imports in the coming years. Supply issues are amplified as government price supports keep farmers producing rice and wheat for human consumption rather than feed grains for animal production, and non-GE imports are limited in supply and purchased at a price premium. Without GE imports, India may risk under-supply of affordable feed grains, especially in the long term. Soybean, cottonseed and rapeseed meals are the largest feed meals consumed in India and imports of oilseed meals have increased by 61 percent since 2010,by volume, albeit with high variability from year to year. Compared with other meal types, soybean meal consumption has increased the most rapidly since 2010 at 63 percent. Cheaper edible oil imports (i.e. palm oils) have made Indian soymeal noncompetitive in international markets and discouraged the development of domestic crushing. India’s imports of distiller’s dried grains (DDGS) and other feed and fodder from the world have been small but are growing quickly. Although India’s feed industry, worth $15 billion, has been growing at an annual growth rate of 8 percent,xvii India’s ability to ramp up feed production in the short and medium term is largely unclear, especially given that the government’s policies traditionally focus on food crops, making the government’s supply-side response to rising feed demand uncertain, and the limited availability of land for cultivation.
Exports of U.S. Consumer-Oriented Agricultural Products to India are on the Rise
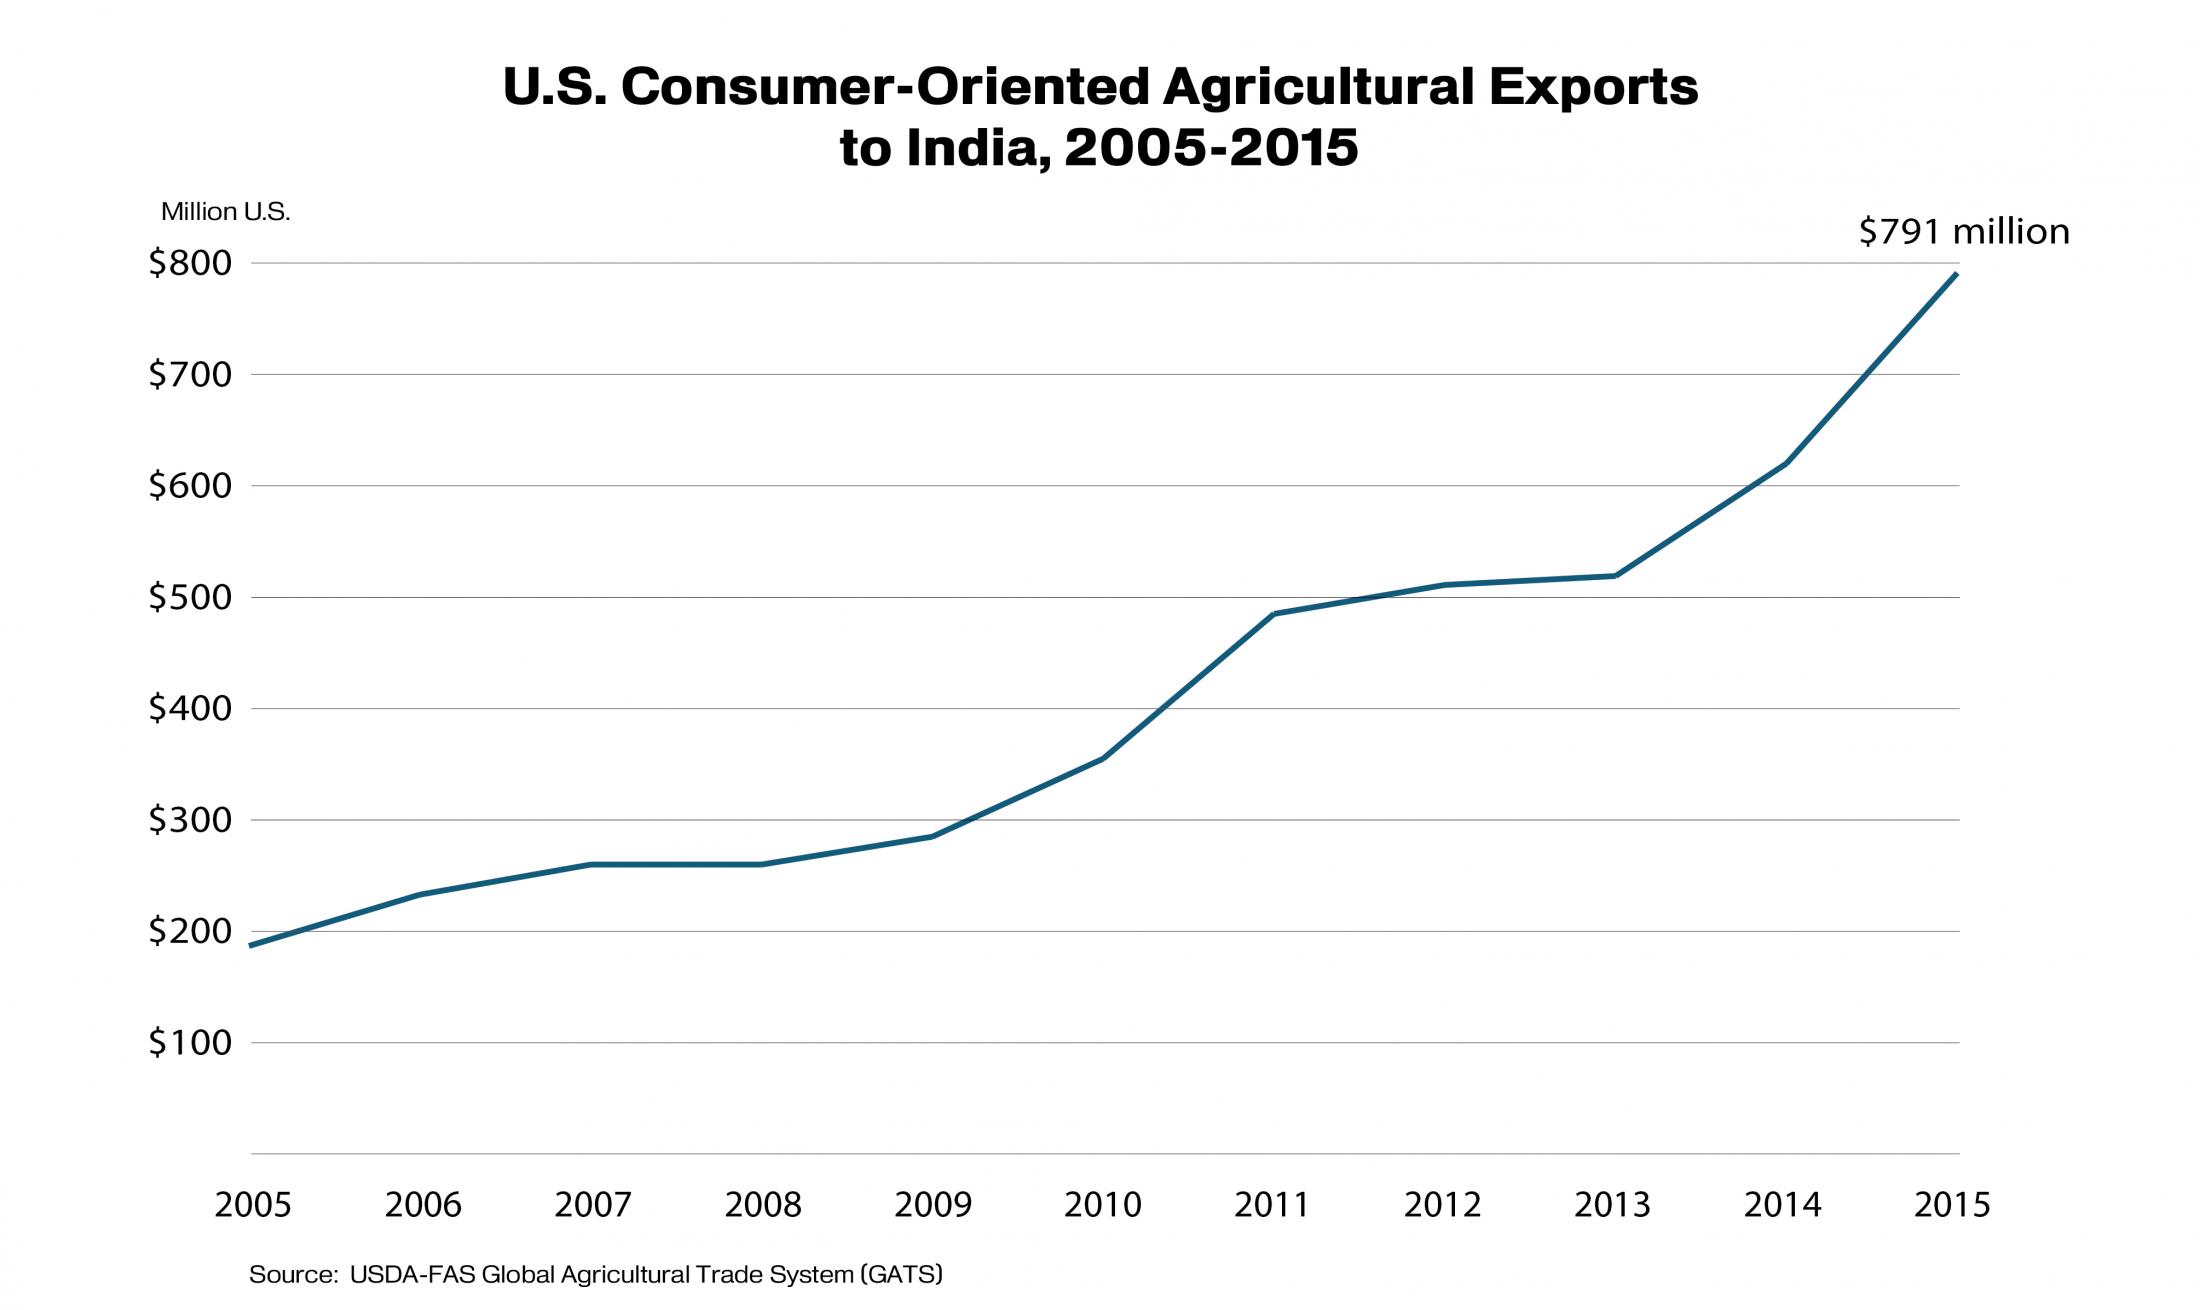
Consumer-oriented agricultural products imported by India from around the world rose 15 percent to $4.5 billion in 2015. Consumer-oriented agricultural products account for 60 percent of U.S. agricultural exports to India, totaling $791 million in 2015. Major U.S. consumer-oriented exports include tree nuts and fresh fruits, as previously discussed. In addition to these, specific U.S. consumer goods with high annual export growth rates and strong market potential in India include chocolate, beverages and processed fruit.
Chocolate: Chocolate and cocoa products are the fourth largest consumer-oriented product group after tree nuts, fresh fruit and spices imported by India from around the world. Chocolate products imported globally into India have increased nearly nine fold from 2005 levels to $205 million in 2015. Exports from the U.S. show strong growth during January through August 2016, totaling $8.1 million, up 48 percent from the previous period.
Beverages: Non-alcoholic beverages, wine and distilled spirits present potential for U.S. exports to India. Non-alcoholic beverage imports rose from $20.4 million in 2005 to $123.3 million in 2015, an 83 percent change. U.S. market share is small at $1.2 million, comprised primarily of flavored or sweetened water. India’s global wine imports increased 82 percent since 2010 to $23.2 million in 2015, with U.S. wine at just 5-percent market share by value. U.S. export market share for wine globally is much higher, at 34 percent. Between 2016 and 2030, Indian spending on alcoholic beverages is forecast to rise 10 percent annually.xviii India’s imports of distilled spirits from the world increased substantially from $33.8 million in 2005 to $253.9 million in 2015. The United Kingdom enjoys 79-percent market share, with whiskeys, cordials and liqueurs comprising 94 percent of exports to India. Although imports from the United States are growing rapidly, especially for whiskey, the total value remains low at $6.6 million.
Processed Fruit: India’s market for processed fruit imports hit $93 million in 2015. The largest component of imports was raisins at $53 million, with nearly all of India’s imports coming from Afghanistan. Although the United States is the world’s second-largest exporter of raisins by value, Afghanistan's raisins are preferred in India due to regional proximity and the reputation of high quality raisins (GAIN). Imports of dried apricots and prunes have experienced strong growth, as have jams.

An Uptick in the Magnitude of Indian Agricultural Imports
Rapid industrialization and climate change will continue to constrain domestic food and feed production by raising the scarcity value of land and water, and India’s declining agriculture sector will struggle to supply the products its population demands. Domestic production and consumption trends reveal that food self-sufficiency will be a challenge for India, and increasing the quantity and variety of imports is imperative. Based on current economic and trade data, rising Indian imports of U.S. agriculture is anticipated, in particular for high-value consumer-oriented agricultural goods. Total agricultural imports are expected to continue to rise at impressive rates; however, a huge increase in imports from the United States is more likely in the medium term than the near term. Growth in agricultural imports could be accelerated if India’s protectionist policies and inefficient domestic support programs are re-thought and the pro-economic growth agenda of its current government is realized.
i Calculated from IHS GDP (constant 2005 USD) dataset on India, data version June 2016
ii Calculated from IHS Disposable Income Index (constant 2005 USD) dataset on India, data version June 2016
iii U.S. Census data
iv Government of India, Budget 2016/2017 Link
v Leakages from Public Distribution System and the Way Forward, Indian Council for Research on International Economic Relations, by Ashok Gulati and Shweta Saini, January 2015 (page 28) Link
vi International Food Security Assessment, 2015-2025, GFA-26, USDA/ERS Link
vii International Food Policy Research Institute (IFPRI) ; Welthungerhilfe (WHH) ; Concern Worldwide, 2016, "2016 Global Hunger Index Data" Link
viii International Food Policy Research Institute (IFPRI) ; Welthungerhilfe (WHH) ; Concern Worldwide, 2015, "2015 Global Hunger Index Data" Link
ix United Nations Development Program, Human Development Report 2015, Page 228 Link
x IHS Country Reports – India, IHS Economics and Country Risk, July 16, 2016
xi Friend, Elizabeth, Meat Consumption Trends in Asia Pacific, and What They Mean For Foodservice Strategy, Euromonitor, August 25, 2015 Link
xii Office of Registrar General & Census Commissioner, sample registration system (SRS) baseline survey 2014 released by the registrar general of India. Table 5.1. Link
xiii Cherry, Drew, What’s holding back India’s seafood consumption? Euromonitor, June 6, 2016
xiv World Perspectives, Indian Subcontinent Regional Analysis, WPI Staff, July 29, 2016
xv Government of India Press Information Bureau Cabinet Committee on Economic Affairs, Minimum Support Prices for Kharif Crops of 2016-17 season, 1 June 2016 (Accessed 9/13/2016) Link
xvi Indian Subcontinent Regional Analysis September 16 2016 Link
xvii Financial Express, “Animal Feed Industry Poised to Double to $30 billion in 5 years”, 20 June 2015 (Accessed 9/13/2016) Link
xviii IHS Country Reports – India, IHS Economics and Country Risk, July 16, 2016
