Blueberries Around the Globe – Past, Present, and Future
Contact:
Link to report:
Trade and production of blueberries is expanding globally as product development boosts their profile in form and function. Hailed for their flavor, versatility, and health benefits, blueberry consumption has expanded beyond fresh, ranging from pureed to powdered forms. Blueberries are also being used as ingredients and additives in foods and beverages. These new uses and forms of blueberries are combining with increasing fresh consumption to drive up production worldwide. Global production and trade have seen the most dramatic growth between 2010 and 2019, driven ever higher by mounting consumer demand.

Domestication of Blueberries: From Idea to Industry
The development of cultivated blueberries began in the early 1900s through the collaboration of Elizabeth White and USDA botanist Frederick Coville. Living on a cranberry farm in New Jersey, White started conducting her own research into wild highbush blueberry plants in the 1890s. Coville began his research on cultivating wild blueberries in 1908. After they began corresponding, White eventually invited Coville to work with her on her family farm. They become business partners in 1911, harvesting and selling their first commercial crop of blueberries in 1916.1
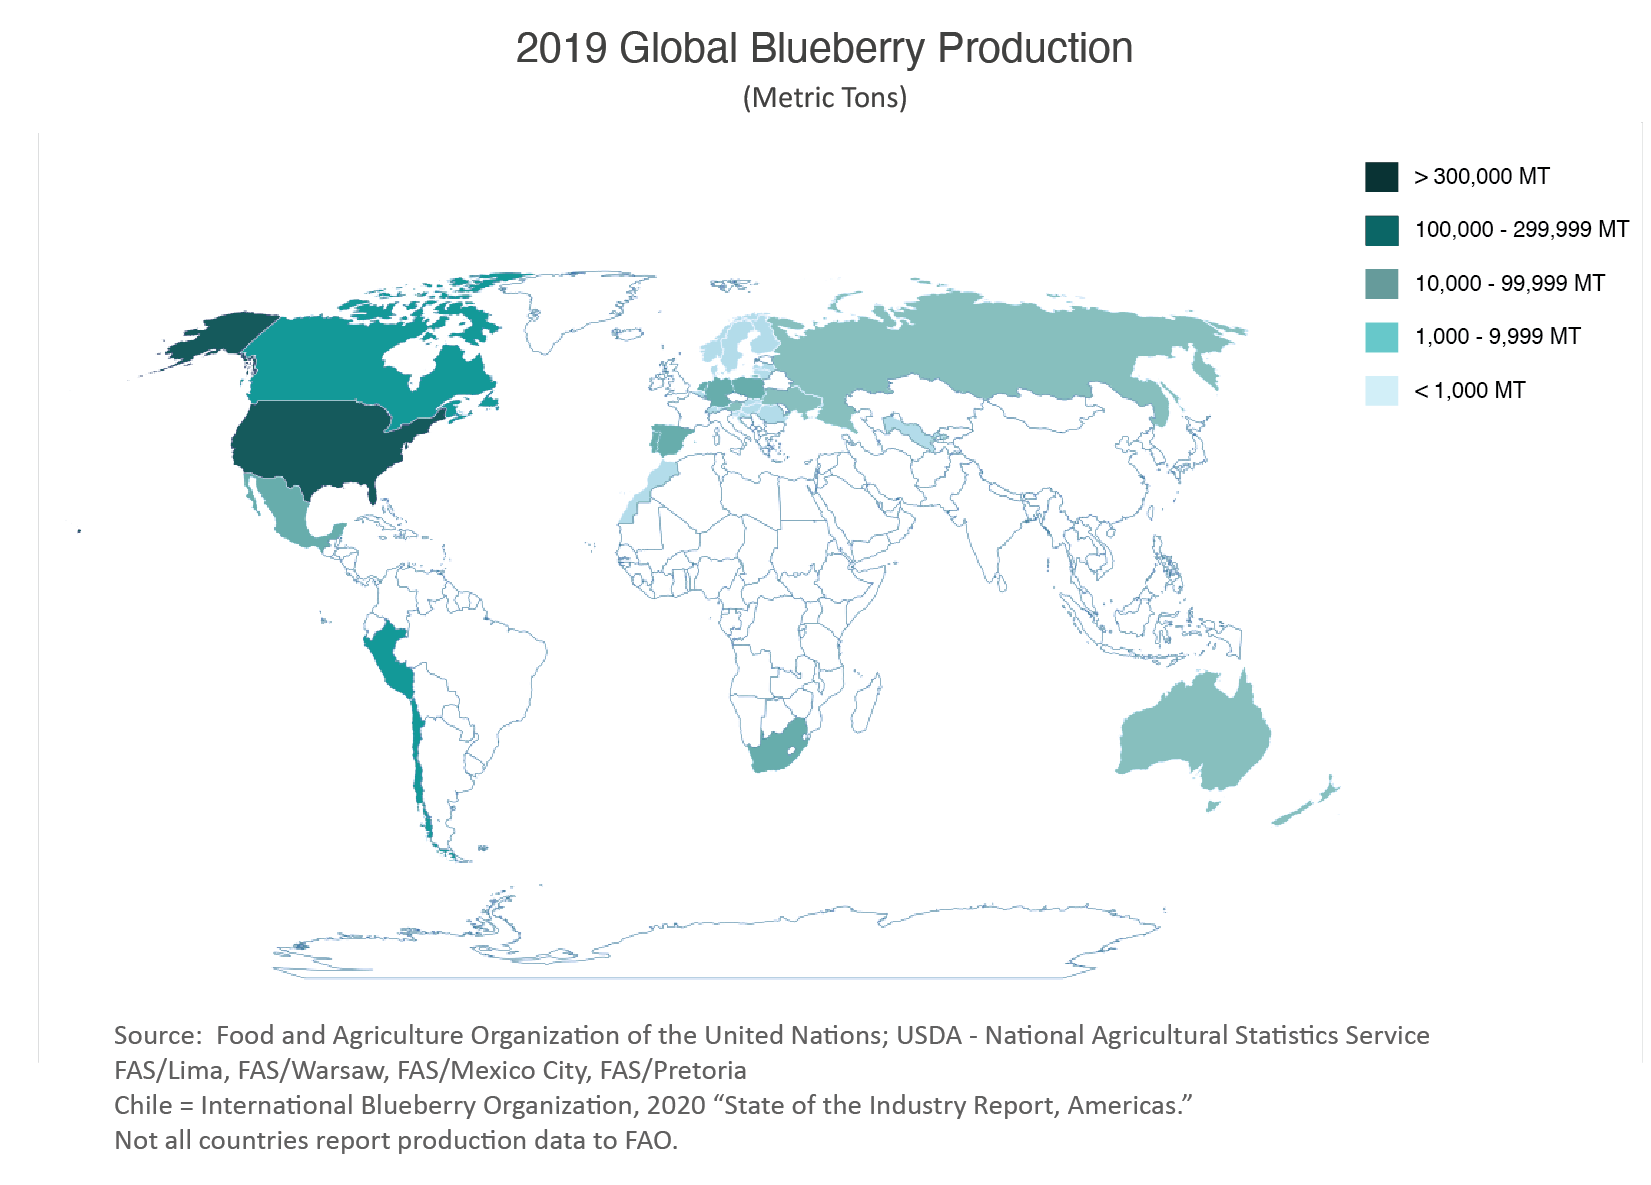
Since then, commercial blueberry production has expanded in the United States and to every continent except Antarctica. Enabled by advances in genetics and production practices, blueberries were grown in at least 30 countries in 2019 and in a variety of climates. The major classes of blueberry plants now grown commercially are highbush, lowbush (sometimes referred to as wild), half-high (a cross between highbush and lowbush species), Rabbiteye, and Southern highbush. Plant production can be short or long-lived, with some cultivar plants productive for as little as 1-5 years or as long as 40-60 years.2
Global Production
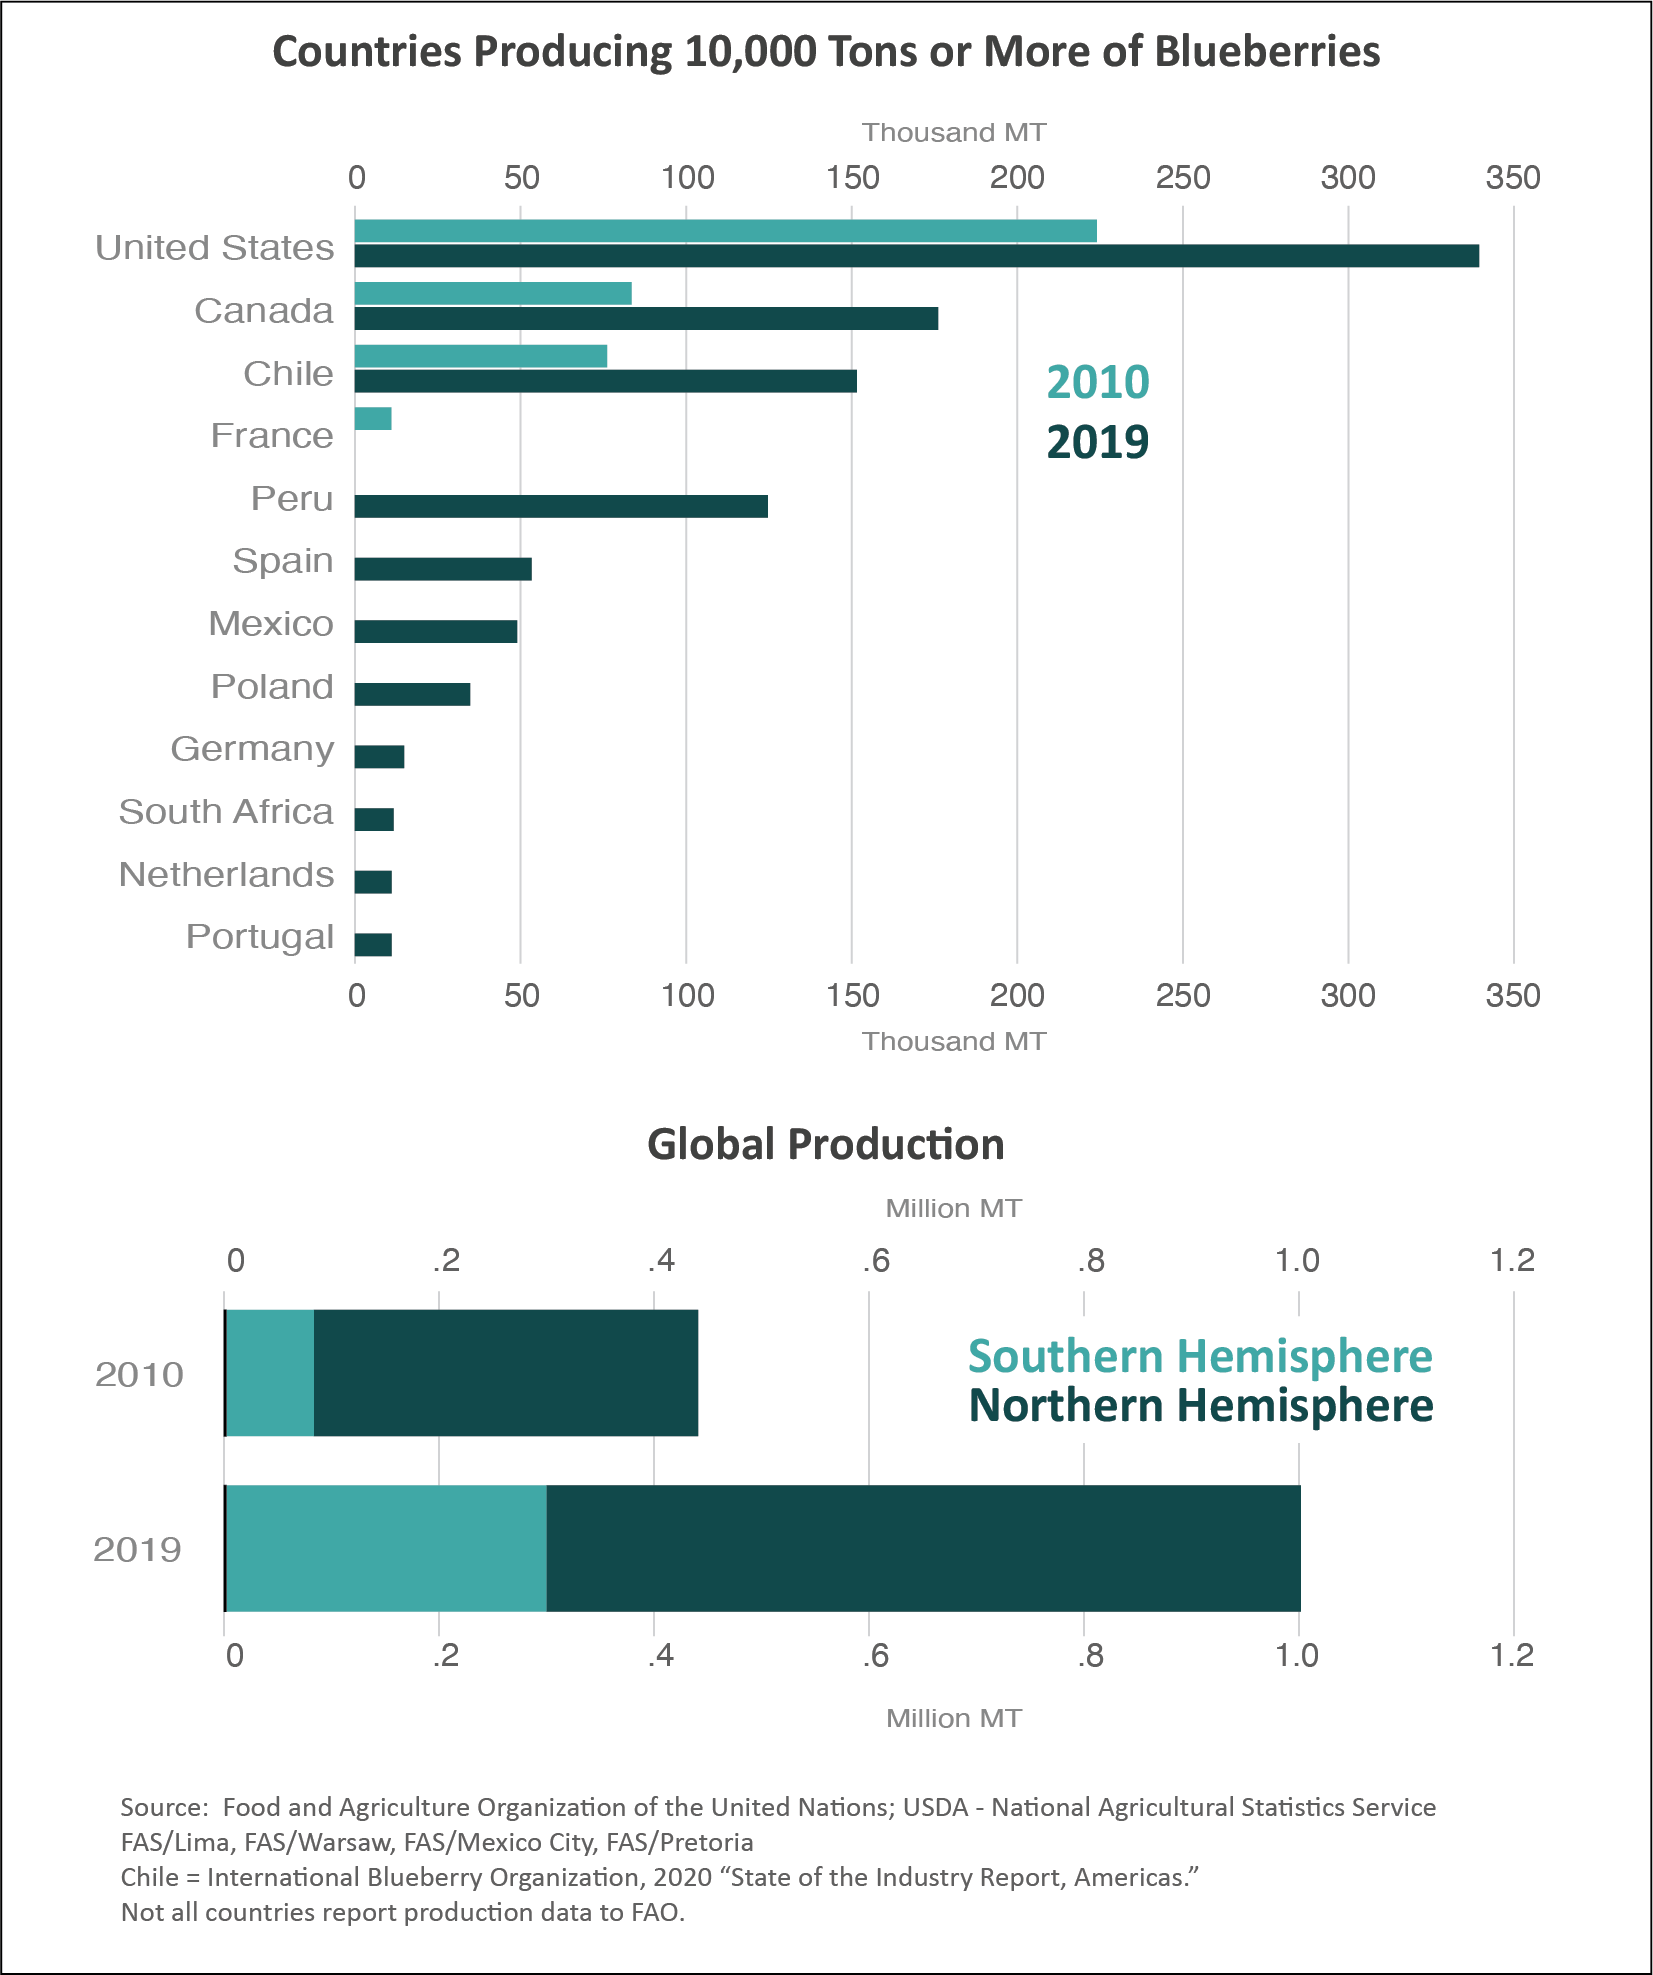
Global production3 more than doubled between 2010 and 2019, rising from 439,000 metric tons to nearly 1.0 million. During this time, the number of countries with reportable production expanded from 26 to at least 30, with 27 countries showing growth. In 2010, only 4 countries produced more than 10,000 tons: the United States (224,000 tons), Canada (84,000 tons), Chile (76,000 tons), and France (11,000 tons). The number of countries producing at least 10,000 tons started increasing by 2012 and has not declined since then. By 2019, at least 11 countries were above the 10,000-ton threshold. Peru had the most dramatic expansion, rising from less than 50 tons to nearly 125,000 to become the fourth-largest producer behind the United States, Canada, and Chile. Peru is now the world’s leading exporter by value.
Southern Hemisphere countries account for nearly 40 percent of the world’s production growth during this time, reaching close to 300,000 tons in 2019. The spread of production to the Southern Hemisphere has expanded blueberries’ seasonal market presence to all 12 months of the year, boosting availability for consumers and driving worldwide demand.

In the United States, blueberries are the second-most produced berry.4 Until the early 1970s, they were commercially grown mostly in three states: New Jersey, Michigan, and North Carolina.5 The industry worked to develop production in other states. In the 1990s, U.S. production reached 100 million pounds or more than 45,000 tons. In 2010, Michigan was the largest producer at almost 50,000 tons, accounting for 22 percent of U.S. production. Other states were expanding output, with Washington becoming the top grower in 2015. Washington remains the leading producer averaging 58,000 tons per year and 19 percent of U.S. production, while Oregon is a close second averaging 55,000 tons. The number of states that USDA’s National Agricultural Statistics Service includes in its annual survey was reduced from 14 states to 9 states in 2018 (the other 5 states accounting for less than 5 percent of production). However, production has continued to rise, reaching a record 339,000 tons in 2019. U.S. production has averaged nearly 300,000 tons since 2015, accounting for 36 percent of global production.
Global Exports
The World Customs Organization (WCO) publishes the International Harmonized Commodity Description and Coding System (Harmonized System or HS), a “multipurpose international product nomenclature” that is a hierarchical framework consisting of 4- and 6-digit classification codes (referred to as headings and subheadings, respectively). Currently, blueberries do not have their own 6-digit classification code. Under the HS, they are classified and harmonized in HS-6 codes that group them with other fruits of the genus Vaccinium (including cranberries), making it difficult to get an accurate understanding of actual blueberry trade. (See section below “Working Towards Better Trade Data.”) By using data from the U.S. Census, Food and Agriculture Organization of the United Nations (FAO), and industry as a guide, leading fresh blueberry exporters include Peru, Chile, Mexico, the United States, South Africa, Poland, and Canada.
Though the value of fresh blueberry export trade is not known for all exporting countries, looking at these countries gives a good indication of the export situation. Using U.S. Census Bureau, Trade Data Monitor, and country data provided by FAS’s overseas offices, exports for these countries totaled $2.1 billion in 2019. For these seven countries, combined growth has averaged 18 percent annually since 2016, with Peru, Mexico, Poland, and South Africa seeing continuous growth. If exports average only 5 percent growth during the next 5 years, export value for these countries alone will reach nearly $3.0 billion by 2025. According to FAO data,6 global export volume has not declined since at least 2010, rising on average 46,000 tons per year between 2015 and 2019. Considering the expansion in production and exports since 2010 and the continued rise in consumer demand, exports of fresh blueberries are expected to continue their upward trajectory.
Growth has been more moderate for U.S. exports. While the export value of fresh blueberries has grown 30 percent between 2010 and 2019, exports experienced 4 straight years of decline between 2014-2017, some of which coincided with years of lower output. On either side of that timespan, exports had peaked at $147 million in 2013 and have seen continuous growth since 2017, rising from $107 million to nearly $121 million in 2020. For 2021, January-July exports are slightly ahead of last year, up $3 million to nearly $99 million. On average, more than 80 percent of U.S. shipments go to Canada, valued at more than $106 million in 2020. Among the seven leading exporters, the United States ranks fourth behind Peru, Chile, and Mexico.
The Future of Global Production
Research into varieties no longer relies on public institutions but is now also happening in private industry, resulting in more rapid advances in genetics and varietal development. Research is underway to improve yield, berry quality, disease and pest resistance, and cold and heat resistance. Improvements are also happening in technology to better manage, harvest, and package crops. For example, due to its range of required chill hours (from 400 to 0 hours), Southern highbush cultivars can be grown as an evergreen, a system of managing bushes to produce berries year-round or at specific points in time. Depending on the geographic area, “evergreening” can prevent or manage defoliation through timing and severity of pruning. While prevention enables year-round production, managed defoliation allows growers to control or target when berries will be ripe, and therefore when they can be harvested. For managed defoliation, depending on the cultivar, the time period between pruning and harvest ranges from 5 to 8 months. For example, if aiming for a May harvest, bushes would be trimmed in January. While evergreen production is used in some areas of the United States, it has also allowed the spread of blueberry production to areas with warmer climates such as Australia, Mexico, Peru, and Spain.7
Current blueberry varieties are all within genus Vaccinium and section Cyanococcus. However, wild varieties outside Cyanococcus are known to exist around the world, including in more isolated areas such as islands in the South Pacific. With the success of blueberries, some of these countries are starting to cultivate their wild varieties. The current level of science does not yet easily allow the combining of genetics from Cyanococcus and non-Cyanococcus varieties. Expected advances in genetic technology will likely make this possible in the coming decades, leading to the development of new varieties and further spreading blueberry production.8
Working Towards Better Trade Data
As noted above, blueberries are included in HS-6 codes that group blueberries with other fruits of the genus Vaccinium, such as cranberries and bilberries. Under the HS, blueberries are currently classified and harmonized globally at the HS-6 level subheadings of 0810.40 (fresh), 0811.90 (frozen), and 0813.40 (dried). Monitoring blueberry trade is challenging because only some countries break out blueberries beyond the HS-6 level as the United States does for fresh, frozen, and dried.
Due to the considerable growth in global blueberry production and trade in the past 10 years, especially trade in fresh blueberries, FAS has prepared a proposal to submit to the WCO to amend the HS by creating specific subheadings for fresh, frozen, and dried blueberries, thereby distinguishing them from other Vaccinium fruit. Proposals for amendments to the HS are typically submitted by the industry. However, due to the need for global trade data, FAS has undertaken this effort to provide clarity on trade (and thus production) and achieve a more precise understanding of how large the market is and where trade (and thus production) is happening.
The following are the steps for submission, review, and approval for amendments to the HS:
- Proposal is submitted to U.S. International Trade Commission (USITC) – if approved, USITC submits the proposal to the Trade Policy Staff Committee (TPSC).
- TPSC approval – if approved, USITC submits the proposal to the World Customs Organization HS Review Sub-Committee (WCO HS RSC) as an agenda item for their next meeting.
Note: TPSC is an interagency committee that includes representatives from USITC, USDA/FAS, the Department of State, the Department of the Treasury, the Office of the U.S. Trade Representative, the Department of Commerce, and the Department of Homeland Security/Customs and Border Protection. - WCO HS RSC approval – if approved, the WCO HS RSC submits the proposal to the WCO HS Committee (HSC) for review at their next meeting.
- WCO HSC approval – if approved, the proposal is forwarded to the WCO for adoption.
- WCO adoption – if adopted, the proposed coding changes will be reflected in the next iteration of the HS, which means it will also be reflected in the Harmonized Tariff Schedule of the United States.
FAS submitted a proposal to USITC in September 2021. If it successfully proceeds through the above process, the proposed changes will be reflected in the 2027 HS. Though it will be several years before the changes are implemented, ultimately the changes will significantly improve our ability to understand and forecast blueberry trade.
1 USHBC website: https://blueberry.org/about-blueberries/history-of-blueberries/
2 USDA/AMS, “USDA Vaccinium Crop Vulnerability Statement 2016, Section 1: Blueberries,” Small Fruit Crop Germplasm Committee.
3 Food and Agriculture Organization of the United Nations (FAO); USDA/NASS; FAS/Lima, FAS/Warsaw, FAS/Mexico City, FAS/Pretoria; Chile = International Blueberry Organization, 2020 “State of the Industry Report, Americas.
4 “Fresh Blueberry Supplies Expand as U.S. Consumers Develop a Taste for Year-Round Blueberries”, USDA/Economic Research Service, December 7, 2020 (https://www.ers.usda.gov/amber-waves/2020/december/fresh-blueberry-supplies-expand-as-us-consumers-develop-a-taste-for-year-round-blueberries/).
5 “A Vision for Blueberries with Denny Doyle,” The Business of Blueberries Podcasts, U.S. Highbush Blueberry Council, episode 15, September 23, 2020.
6 "Blueberries” is identified by FAO as 081040. FAO export data is available only through 2019; not all countries report export data to FAO, including Argentina, Chile, and Mexico.
7 “A Review for Southern Highbush Blueberry Alternative Production Systems,” MDPI, Agronomy, volume 10, issue 10, October 2020.
8 Phone call with Dr. Kim Hummer; Research Leader, USDA/ARS National Clonal Germplasm Repository; Corvallis, OR
