Opportunities for U.S. Agricultural Products in Singapore
Contact:
Link to report:
Executive Summary
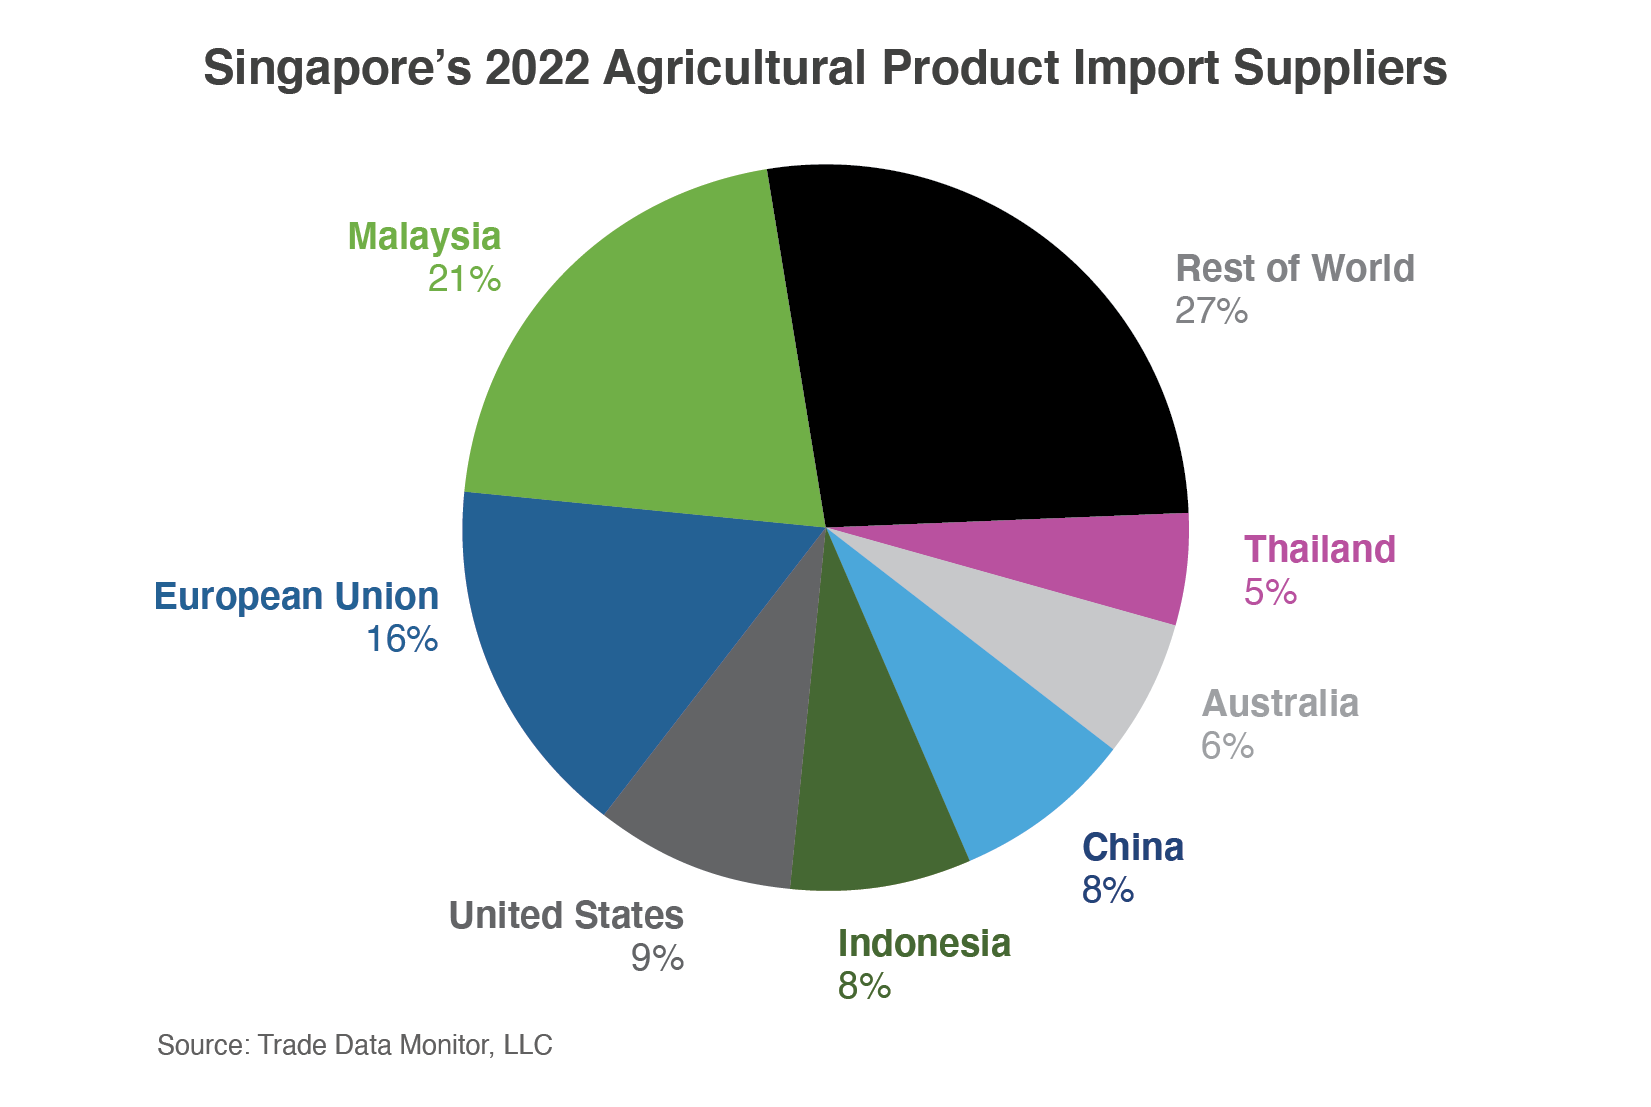
Singapore imports more than 90 percent of its food and has a diverse, competitive array of trading partners. The United States and Singapore have a long-standing free trade agreement (FTA), and Singapore is a well-developed market for high-quality food and agricultural products. In 2022, the United States exported $1.4 billion worth of agricultural products to Singapore. The United States’ top agricultural exports to Singapore in 2022 were largely consumer-oriented products such as food preparations, dairy products, meat and meat products, potatoes, fresh fruit, and confectionary products. These and other consumer-oriented products, such as alcoholic beverages and pet food, have the potential for increased market share. Consumers in Singapore are affluent, technically savvy, and interested in healthy and innovative foodstuffs.
Macroeconomic Perspective
Singapore is a high-income country with a per capita gross domestic product (GDP) of $91,100 U.S. dollars (USD) in 2022 and a population of about 5.7 million.1 Despite strong economic performance in 2021, Singapore’s economic growth slowed in 2022 to real GDP growth of 3.6 percent (it was 8.9 percent in 2021), while the average growth rate for the Asia-Pacific region was 4 percent, according to the International Monetary Fund (IMF). The slowdown is expected to continue, with the average annual rate of real growth for 2022-2027 forecasted at 2.1 percent, according to Euromonitor. In 2023, the IMF expects the annual inflation rate based on average consumer prices to drop to 5.8 percent from 6.1 percent in 2022. Due to its importance as a regional hub, many multinational companies have their Asia-Pacific headquarters in Singapore, including processed food companies and commodity traders.
Consumption Trends and Market Drivers2
Singapore is very dependent on imports for food due to its small geographical size, which constrains agricultural activities. In 2022, according to Euromonitor, food and non-alcoholic beverages saw some of the largest price increases compared to other product categories due to inflationary pressures. Euromonitor research found that consumers flocked to convenient, modern supermarkets and hypermarkets during the pandemic and in the face of inflationary pressures, as these outlets offered cheaper private-label brands and lower prices due to close relationships with suppliers. Singapore is a tech-savvy and innovative market. According to Euromonitor, as of 2022, 94 percent of the population uses the internet, and 42 percent use it to buy and sell goods and services, with 59 percent of businesses placing and receiving orders online and grocery e-commerce sales growing nearly 30 percent between 2017 and 2022. Key buyers of agricultural products include food and beverage companies, pet food and animal feed companies, and the textile and leather industries. Products with double-digit year-over-year growth in 2021 included meat and dairy products and textile and leather products, according to Euromonitor. Despite having a diverse array of trading partners, Singapore’s food imports can be adversely affected by those partners’ production and trade policies. For example, in 2022, Malaysia banned chicken exports due to domestic supply issues, and bad weather affected Malaysia’s vegetable crop yields, which in turn spiked food prices in Singapore.3
Trade Policy
Singapore has 27 FTAs, including regional agreements such as the Comprehensive and Progressive Agreement for Trans-Pacific Partnership. The U.S.-Singapore FTA has been in place since 2004. Singapore is an active member of the Asia-Pacific Economic Cooperation and Codex Alimentarius fora, as well as the Association of Southeast Asian Nations. In 2022, according to Euromonitor, Singapore ranked first out of 184 countries on the Index of Economic Freedom (IEF) and stood first as part of the IEF Trade Freedom Pillar, highlighting its favorable trade environment, free-market principles, and low- and non-tariff barriers. Singapore has a national strategy to promote food security, develop new agricultural technologies, and support the agri-food sector via its Agri-Food Cluster Transformation Fund.4 Singapore has robust intellectual property regulations and is a member of the World Trade Organization.
For additional information, please refer to the most recent USDA Exporter Guide and FAIRS Report.
Prospects for U.S. Agricultural Exports
Dairy Products
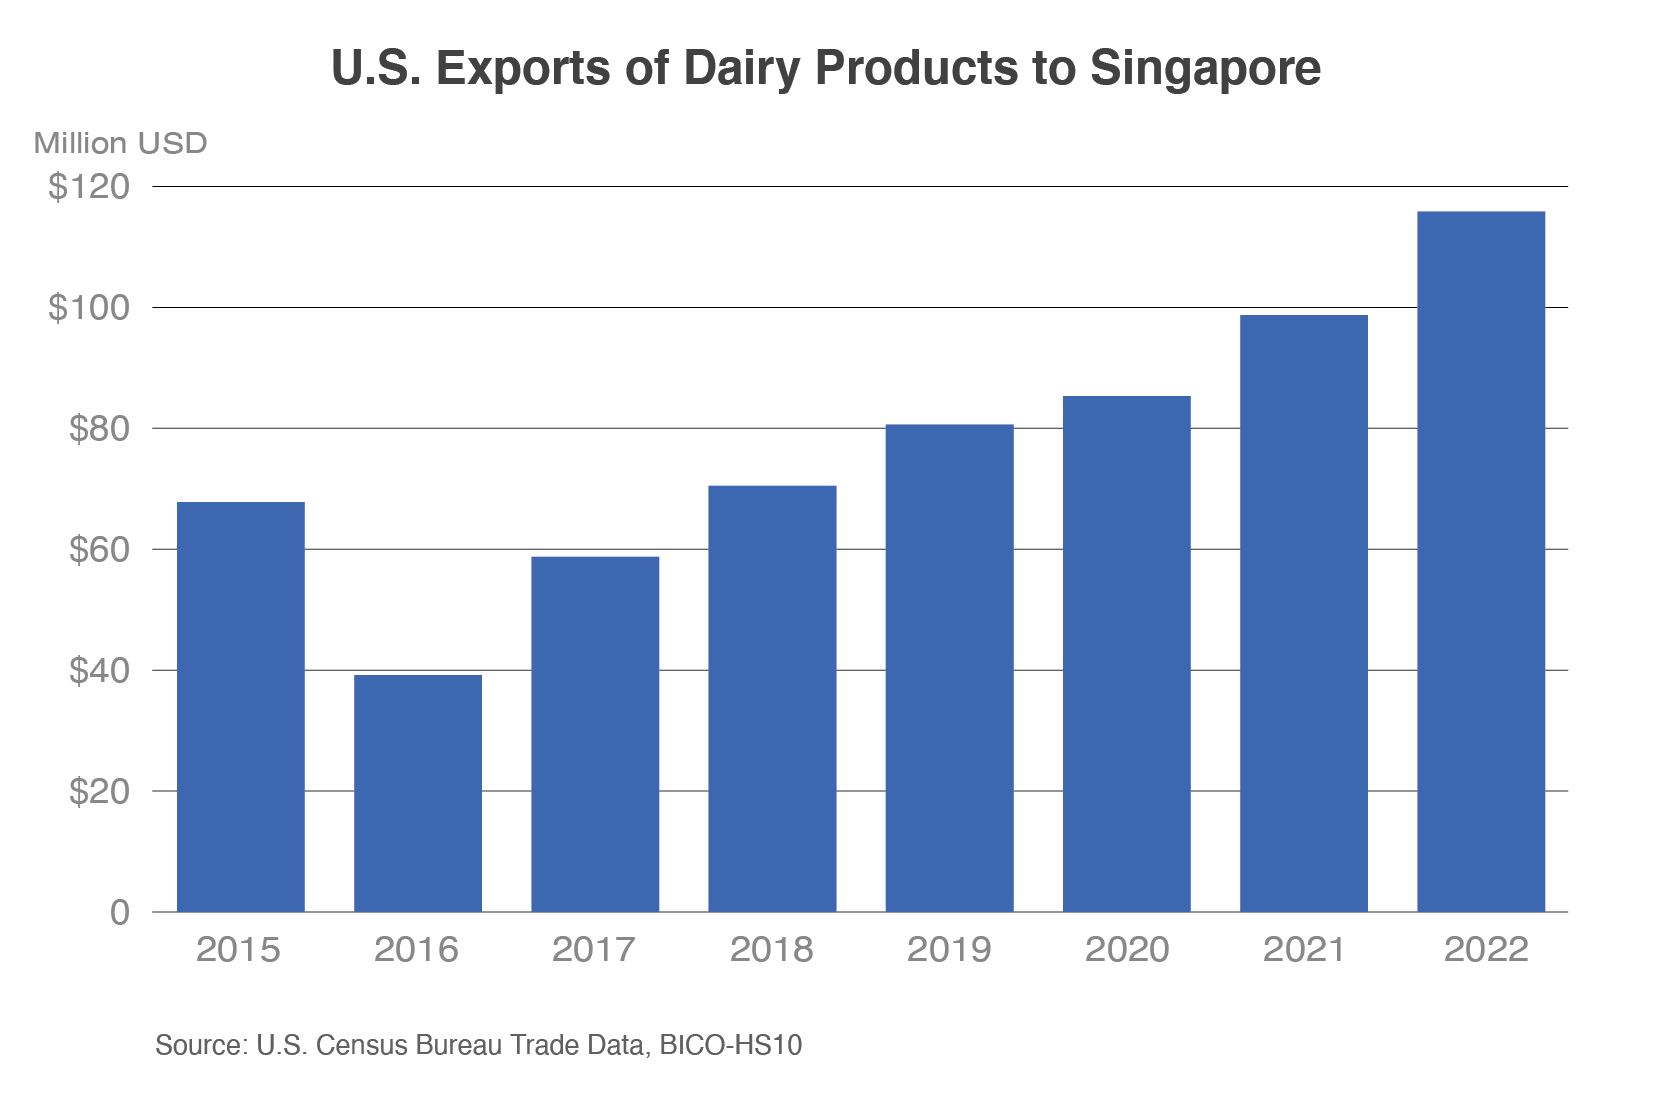
U.S. dairy product exports to Singapore in 2022 grew 17 percent and reached an all-time value record of $116 million, consisting of milk albumin and whey protein, dry milk powder, lactose, cheese, and other products. Singapore imported a total of $1.3 billion worth of dairy products in 2022 from all sources, with the top five suppliers being New Zealand, the European Union, Australia, the United States, and Thailand. According to Trade Data Monitor, the United States’ market share grew to 9 percent in 2022, up from just less than 7 percent 5 years ago, when Singapore’s total dairy product imports were just more than $1 billion. According to Euromonitor, upscale supermarket brands market a large range of international cheeses and yogurts, and private labels are capitalizing on demand for essentials like butter. The total consumption value of dairy products in 2021 was more than $3.5 billion.5 The dairy product import market is competitive, with only one company, Malaysia Dairy Industries, carving out a 10-percent share.6 There is competition from plant-based alternatives, but Euromonitor anticipates rising demand for products like butter and condensed/evaporated milk through foodservice channels.
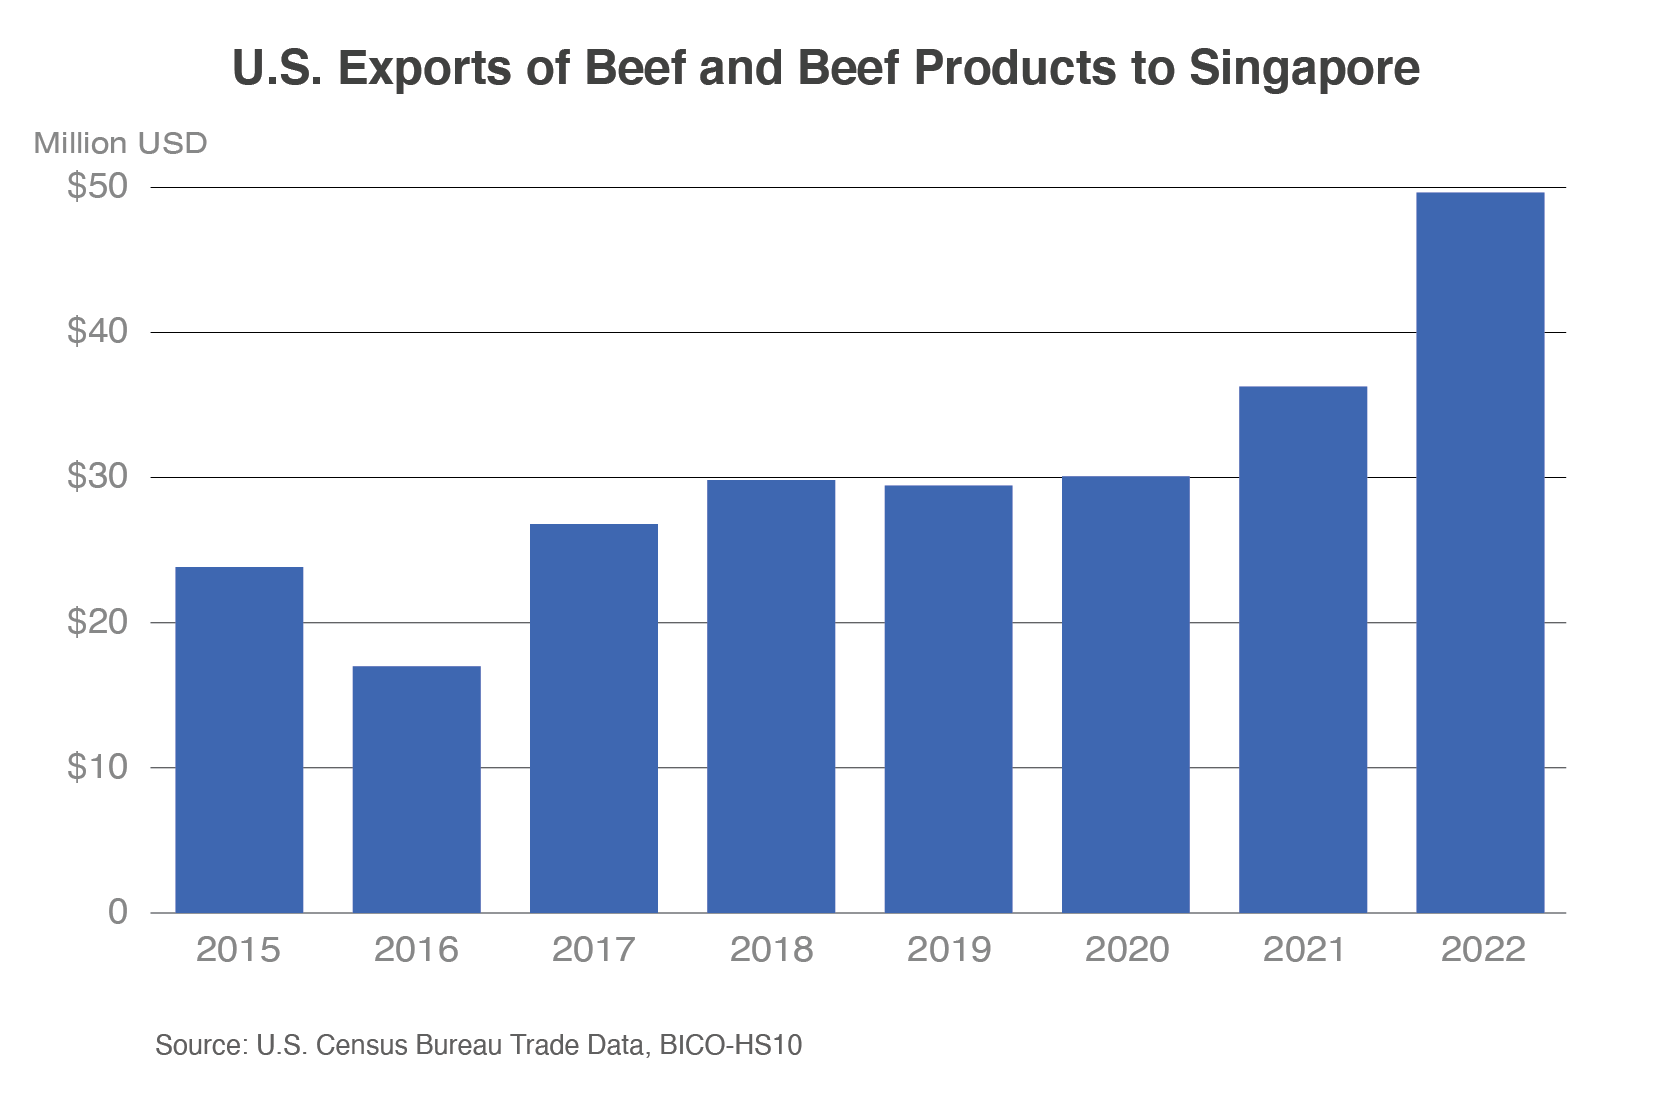
U.S. exports of beef and beef products rose to an all-time value record of $49.6 million, 37 percent higher than 2021; this record was in part because export prices were also a record high. The largest component of these exports was frozen, boneless meat. Singapore imported a total of $351 million in beef and beef products in 2022, up from $253 million in 2018. U.S. market share was nearly 15 percent in 2022, up from 12 percent in 2018. Consumer confidence in the cold chain was boosted during the pandemic, and there are still strong e-commerce sales of frozen, processed meats.
Dog and Cat Food
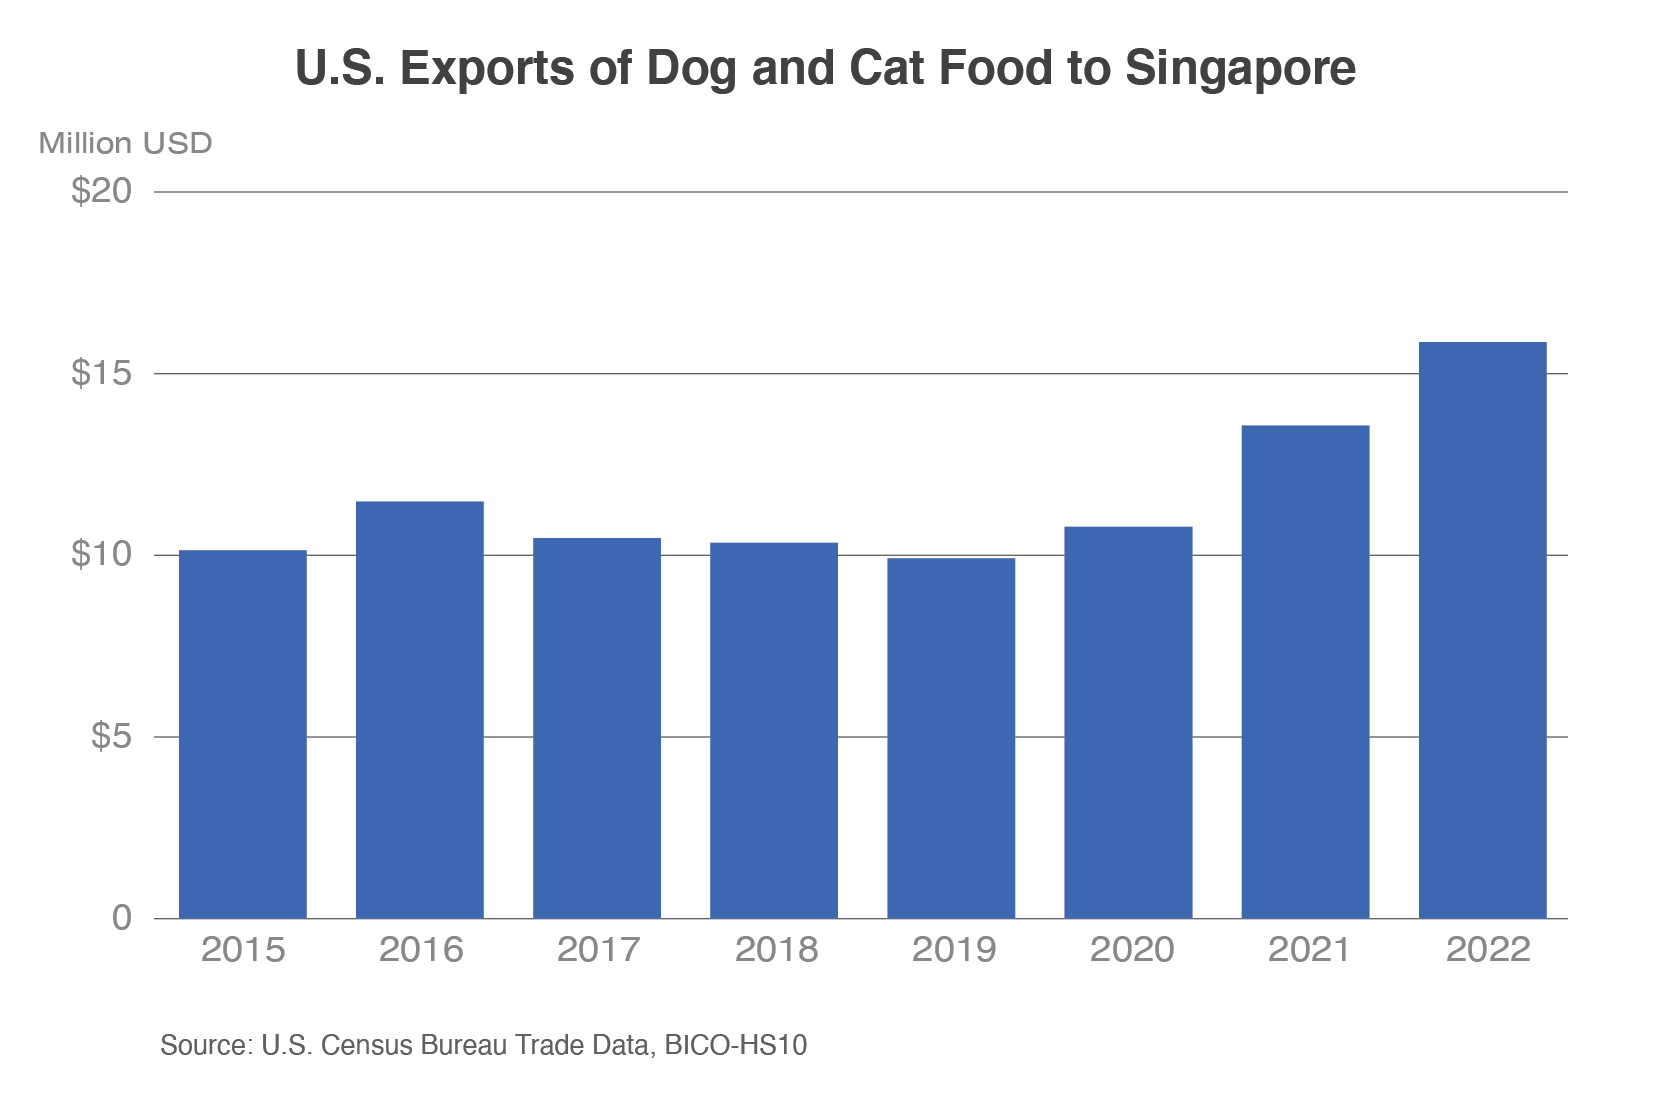
In 2022, Singapore imported a total of $69.2 million in dog and cat food products from all sources, well above the $43.7 million imported in 2018. Singapore has a growing trend in the humanization of pets, with pet owners increasingly treating their pets as integral parts of the family. Pet ownership increased during the pandemic, though growth has begun to slow.7 The retail value of cat food sales is expected to grow 7 percent in 2023, and Euromonitor also notes that e-commerce is an important retail channel for distribution. The retail value of dog food sales is expected to grow around 6 percent in 2023, with pet health preferences spurring premiumization and new, innovative products to satisfy demand in terms of diet variety and nutrition.8 According to Euromonitor, there are more than 20 dog food companies, and competition is fierce, with no company holding more than 8 percent of sales; the cat food market is more concentrated. In 2022, the United States exported a record $15.9 million in dog and cat food products, up 17 percent from 2021, and held a 23-percent market share in Singapore (second only to Thailand).
Alcoholic Beverages
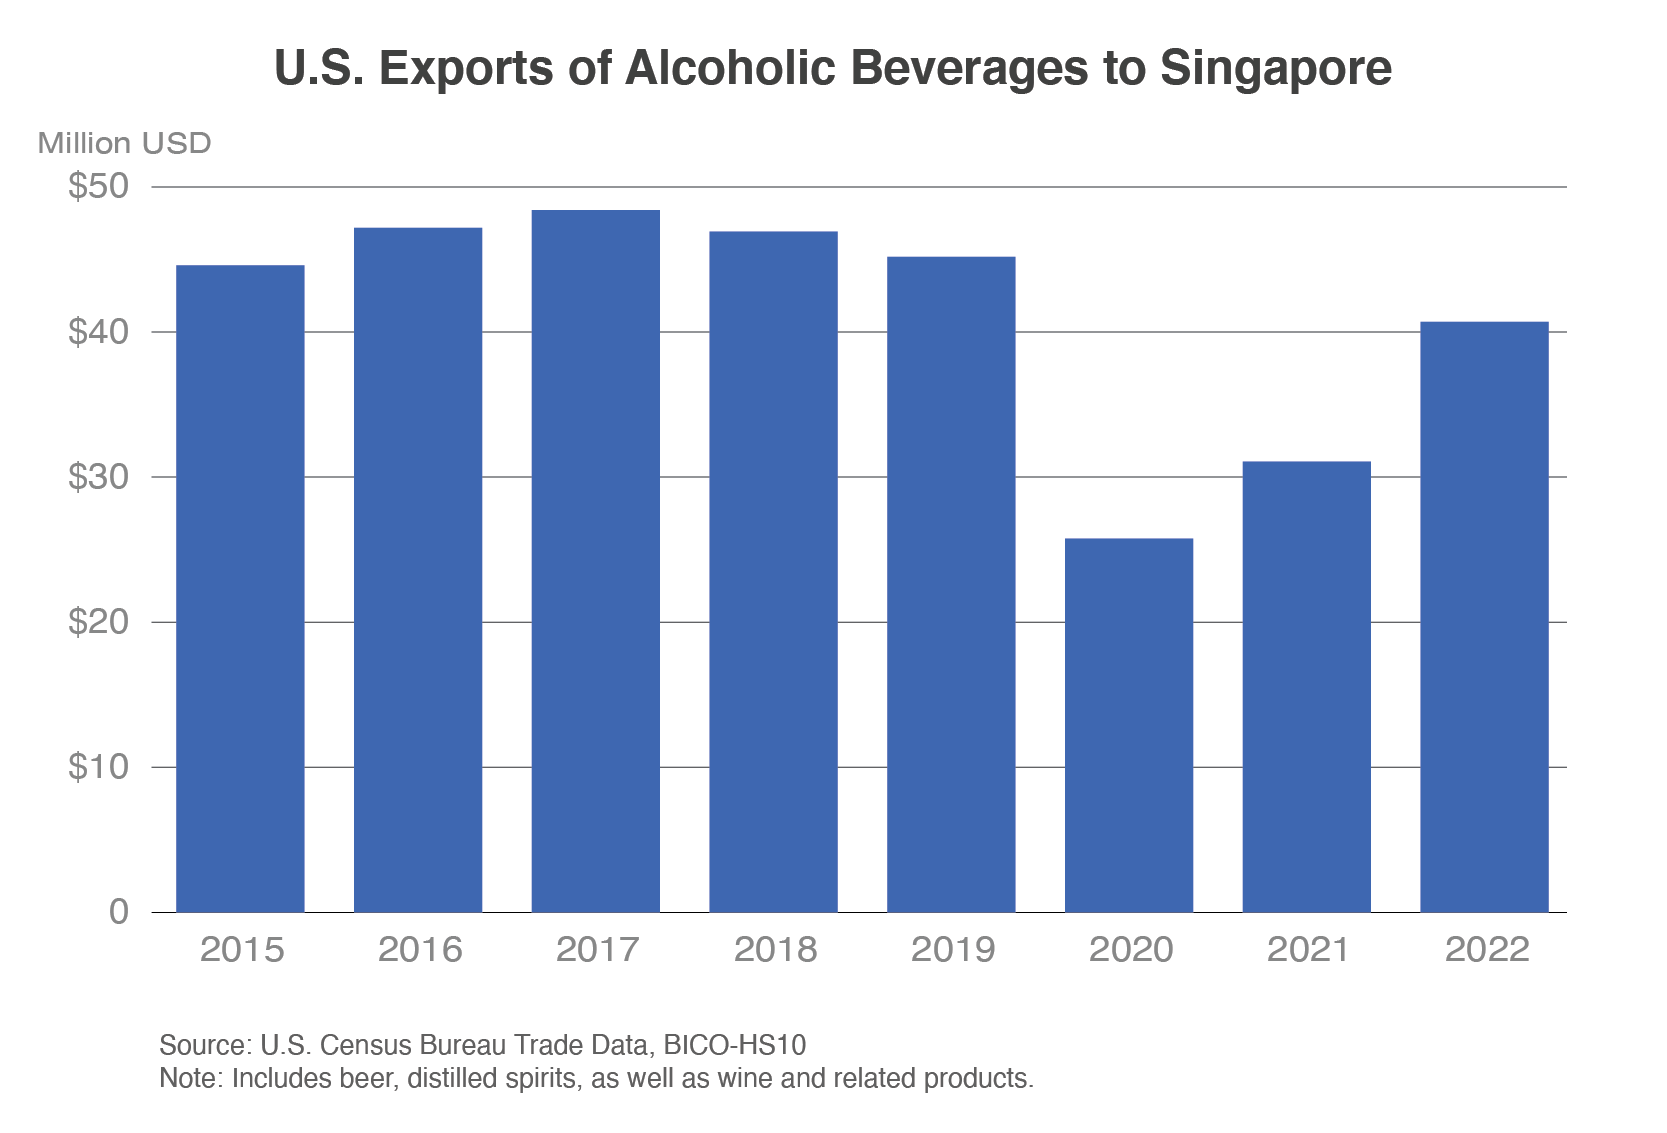
In 2022, U.S. exports of distilled spirits (mostly non-bourbon whiskey) and wine products to Singapore grew by 14 and 20 percent, respectively. U.S. distilled spirits exports reached $15.4 million, which was half of the 10-year high of $31.6 million in 2014. U.S. wine and related products, which have climbed steadily since 2019, reached a value of $16.5 million in 2022, just less than the 10-year high of $16.6 million in 2017. U.S. Census data also showed that U.S. beer exports grew 127 percent in 2022 to a record $8.8 million. In 2022, Singapore imported a total of $2.9 billion worth of distilled spirits, wine and related products, and beer. The United States is a top 10 supplier in these categories, but its market share is just less than 5 percent for beer, 2.6 percent for wine and related products, and 1.5 percent for distilled spirits. Singapore’s bars and pubs saw strong sales value growth in 2022 as the nightlife scene continued to reopen and reinvigorate; this included the removal of a restriction on alcohol sales after 10:30 p.m., which helped businesses increase revenue.9 Euromonitor noted that tourism and hosting world-class events like Formula 1 racing also contributed to strong growth as foot traffic increased. Consumers are interested in brands that make efforts to curb environmental impact, such as reducing single-use glass waste and using circular, sustainable packaging, according to Euromonitor analysis.
Conclusion
U.S. agricultural exports are well positioned in Singapore. Consumer-oriented products are likely to see continued demand growth as tourism continues to ramp up and affluent consumers frequent foodservice and grocery outlets. Singapore consumers and businesses also continue to utilize e-commerce channels. U.S. exports of alcohol could recover some market share on stronger export growth, and opportunities exist for dairy products, beef, and dog and cat food based on strong demand.
1 International Monetary Fund
2 Please also refer to the USDA 2023 Retail Foods Report on Singapore for more information.
3 Euromonitor International Ltd.
4 2022 USDA Annual Agricultural Biotechnology Report for Singapore.
5 Euromonitor International Ltd.
6 Ibid.
8 Ibid.
9 Euromonitor International Ltd.
10 Euromonitor International Ltd.
