Agricultural Imports Soar in Sub-Saharan Africa
Contact:
Economic Growth Drives Food Demand
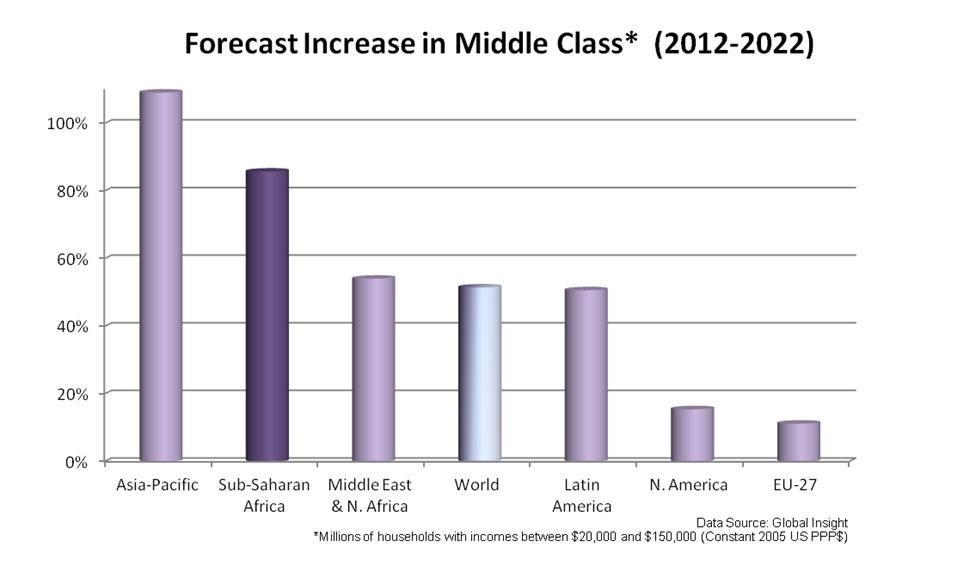
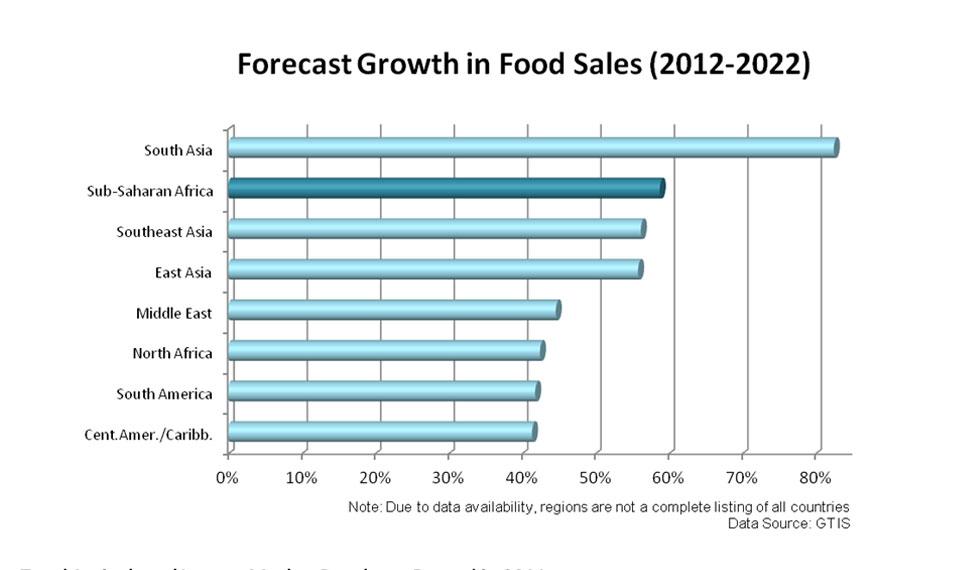
Economic growth in Sub-Saharan Africa over the past five years has been impressive. Even as GDP growth in some of the top U.S. agricultural export markets (Mexico, Canada, Japan, and the European Union) averaged less than 2 percent annually over the five past years, growth in Sub-Saharan Africa increased by more than 5 percent. Looking forward, middle class growth in Sub-Saharan Africa is expected to grow more than 80 percent by 20221, which is faster than any other region except the Asia-Pacific. Likewise, Sub-Saharan Africa is expected to lead all regions, except South Asia, in growth of food sales, which are expected to increase by nearly 60 percent over the next decade.

While growth has been impressive for the region as a whole, several countries stand out as top performers. Economic growth in 2012 was highest in low-income countries such as Sierra Leone, Niger, and Ethiopia2. As a group, low-income countries in the region experienced GDP growth of 5.9 percent in 2012, as compared to 3.4 percent in middle-income countries. Food sales, which reached a record $163 billion in 2012, increased most in percentage terms in Tanzania, Ghana, and Nigeria3.

Total Agricultural Import Market Reaches a Record in 2011
Healthy economic growth and surging food demand in Sub-Saharan Africa pushed food imports to a record high in 2011, with the region’s total agricultural imports from all suppliers reaching $43.6 billion4. At an estimated $37.7 billion, imports in 2012 were the second highest on record, exceeding those of major markets such as Canada, Mexico, South Korea, and Indonesia5. In addition, imports by Sub-Saharan Africa were $16 billion more than India, a country with a much larger population.
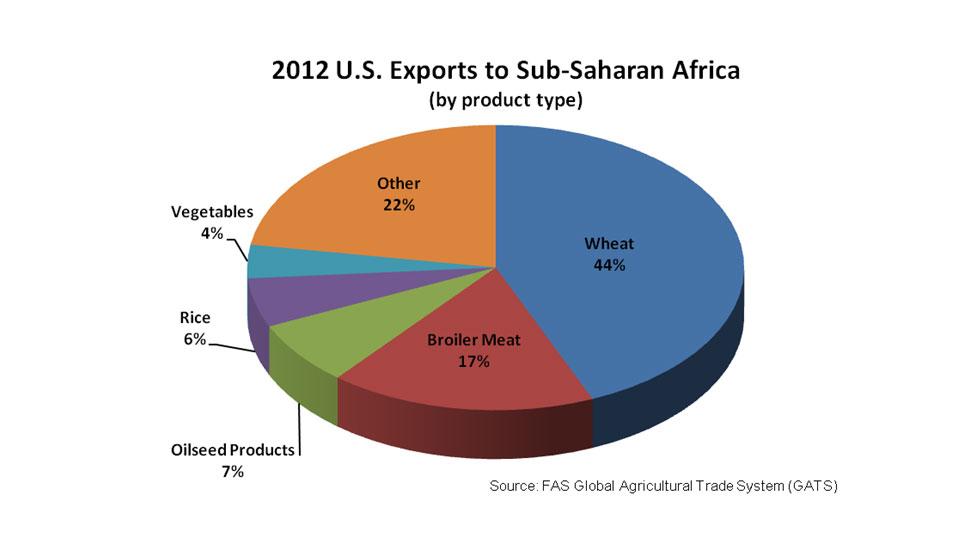
At nearly $6 billion, wheat was a major contributor to Sub-Saharan Africa’s record agricultural imports in 2011. Wheat was followed by rice, vegetable oil, and dairy products. The region’s leading agricultural importers are Nigeria, South Africa, and Angola. Taken together, these three markets comprise 39 percent of Sub-Saharan Africa’s imports. The region’s 46 other countries account for the remainder.
U.S. Exports Soar on Strong Commercial Demand
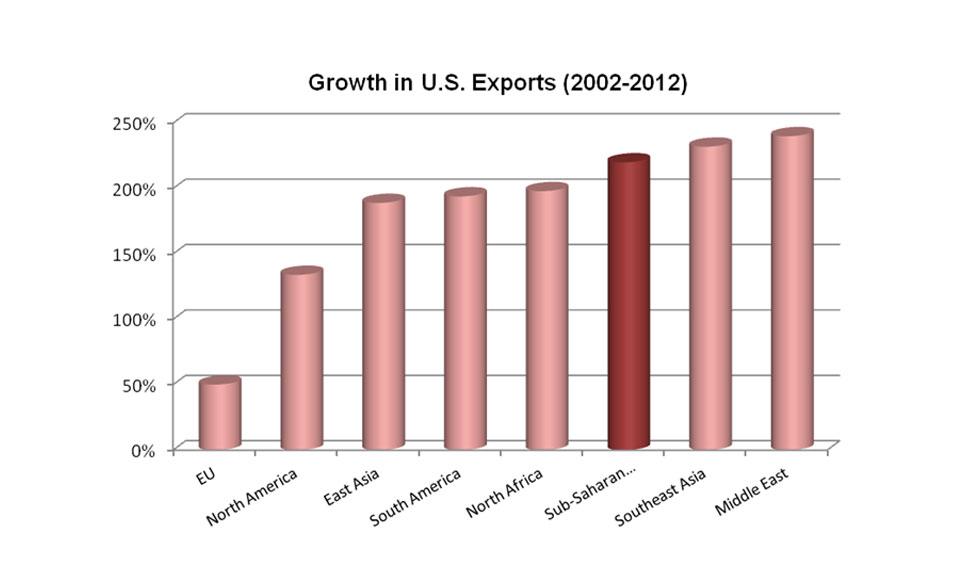
Over the past decade, U.S. agricultural exports to Sub-Saharan Africa have benefited from growing demand, increasing by more than 200 percent. This is a greater rate of growth than U.S. exports to the EU, NAFTA partners, and East Asia. In fact, only the Middle East and Southeast Asia are faster-growing markets for U.S. products. Total U.S. agricultural exports to the Sub-Saharan Africa reached a record $2.9 billion in 2011 and then fell minimally in 2012 to $2.7 billion, the second-highest level ever. The rapid growth of U.S. exports to Sub-Saharan Africa in recent years is largely a result of increasing commercial shipments.

Although Sub-Saharan Africa is a major food-aid recipient, commercial shipments have grown in importance in recent years. A decade ago, food aid comprised more than over half of total U.S. exports to the region, compared to only 21 percent today. U.S. exports to the top four markets in Sub-Saharan Africa (Nigeria, South Africa, Ghana, and Angola) were all commercial shipments in 2012. Taken together, these four countries account for two-thirds of total U.S. exports to the region.
Exports Concentrated in Top Four Markets
Although many countries within Sub-Saharan Africa have significantly increased purchases of U.S. agricultural products over the past five years, U.S. exports are largely destined for the major markets of Nigeria, South Africa, Angola, and Ghana. Excluding food aid, these four markets comprise more than 80 percent of U.S. shipments, with the other 45 countries accounting for less than 20 percent. These four countries stand out as top growth markets globally and rank high among all U.S. global markets in several categories.
For example, Nigeria is the third-largest U.S. wheat market, Angola is the four-largest broiler meat market, and Ghana ranks as one of the top 10 rice markets. Among the 49 countries in the Sub-Saharan, Nigeria stands out as the top market, accounting for nearly half of all U.S. commercial agricultural exports to the region. Although wheat comprises 90 percent of U.S. exports to Nigeria, there is potential for increasing consumer-oriented exports, which have more than doubled since 2009.
Export Competition Intensifies
While the growth of U.S. exports to the region has been impressive over the past five years, United States remains a relatively small supplier of agricultural products to Sub-Saharan Africa. U.S. market share in 2012 is estimated at only seven percent, which is low compared to the United States’ share of other major markets. For example, the United States enjoys a 25-percent market share in China and a 21-percent share in South Korea. Even in Indonesia, where export competitors enjoy a freight advantage, the U.S. share is double that of Sub-Saharan Africa. Furthermore, U.S. market share to the region has fallen slightly over the past several years. This is an indication that while U.S. exports are on the rise, competing exporters may be benefitting even more. This current low market share highlights both the difficulties U.S. exporters face in the market as well as significant potential for growth.
With a 27-percent market share, the EU is the largest exporter to Sub-Saharan Africa, followed by Brazil (10 percent) and India (8 percent). Exporters in the EU enjoy a freight cost advantage along with more flexibility in shipping quantities and delivery times. Furthermore, common languages and colonial ties have helped to establish strong trading relationships.
Total EU exports to Sub-Saharan Africa in 2012 reached $10.2 billion with strong sales of high-value products. For example, while 57 percent of U.S. exports to the region are bulk products, 65 percent of EU exports are consumer-oriented products and only 11 percent are bulk products. Top EU export items include dairy products, wine and beer, and poultry meat. Several high-value products from the EU compete directly with U.S. products, particularly dairy products and poultry meat.
U.S. Exports Have Room to Grow
Wheat is the dominant U.S. export to Sub-Saharan Africa and Nigeria is a top global market for U.S. wheat. However, exports of consumer-oriented products are growing. For example, broiler meat exports are on the rise, particularly to Angola and Ghana. Exports of dairy products, fruits and vegetables, and snack foods have also increased in recent years. Although the EU is the leading supplier of consumer-oriented products to the region – at $6.5 billion in 2012, compared with less than $1 billion for the United States – U.S. shipments are growing at a faster rate. In fact, over the past five years, U.S. exports of consumer-oriented products increased at more than twice the rate of EU exports (135 percent vs. 64 percent).

Although the Sub-Saharan African market is challenging due to governance, security, and market access issues, there is significant potential for continued U.S. agricultural export growth. A strong economic outlook, a growing middle class, and surging demand for consumer-oriented foods all point to Sub-Saharan Africa continuing as one of the fastest-growing export regions for U.S. agricultural products.
1 Source: Global Insight
2 Source: IMF, World Economic Outlook
3 Data not available for all countries in Sub-Saharan Africa
4 Data Source: UN Annual Exporter-Derived Data
5 Data Source: GTIS World Export Data
